Download
1 / 42
420 likes | 627 Views
Building Envelop and Fabric Design for Air Ventilation of High Density Cities. Area: Case Study in Hong Kong. CUHK ID1155011360 SENV 7001 Dissertation Report. Content. 1. 4. Methodology. 2. 5. Study Object. Case Study. 3. 6. Literature Review. Discussion.

E N D
Building Envelop and Fabric Design for Air Ventilation of High Density Cities Area: Case Study in Hong Kong CUHK ID1155011360 SENV 7001 Dissertation Report
Content 1 4 Methodology 2 5 Study Object Case Study 3 6 Literature Review Discussion 7 4 Project Background Limitation & Further Study Hypothesis
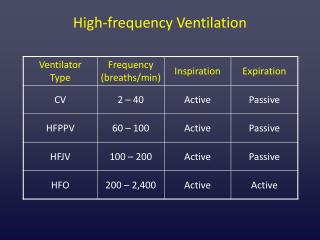
Introduction On the climate prospect, in the warm humid environment as Hong Kong, the cooling strategy is more comprehensive. As for the evaporate cooling would not be applied to contribute to the thermal comfort at the pedestrian level due to the high humidity, natural ventilation would play the main role instead. As the more and more hot nights happen in Hong Kong, the cross ventilation design for the unit is required for cooling as well. With the city development, the density of the buildings in Hong Kong is growing at the highest level. With the density grow, the blockage of wind, especially at the pedestrian level, become the most significant issue for the air ventilation in city of Hong Kong. Accordingly, improvements of building natural ventilation, especially in the high density districts in Hong Kong, in order to improve the human thermal comfort are on agenda. A case study in Price Edward would be conducted to maximum external air ventilation on the site level, by considering the building design effect for the air ventilation at the district level at the same time, given the condition that the project is for a single building design, remains the street pattern of the district.
Study Object • The initial objective of this paper is to mainly explore whether providing more building permeability could achieve better air ventilation at the pedestrian level with a case study in Hong Kong, applying the method of Air Ventilation Assessment (AVA). • For the secondary objective, designing external flat layout to achieve more wind availability, to achieve more possibility for the units would be considered in the study, along with the CFD simulation for testing the cross ventilation results for design decision.
Literature Review Definition of AVA The concept of AVA, Air Ventilation Assessment is a comprehensive assessment system, for assessing “the wind availability and performance of a location could be experienced and enjoyed by pedestrians on ground taking into account the surrounding building and topography and the proposed development” on the site level and district level. The Purpose for promoting Air Ventilation at pedestrian level: • For Thermal Comfort (PET , PMV, NET) • For Human Health--- Severe Acute Respiratory Syndrome (SARS) Building Envelop Design for Natural Ventilation • Building Envelop design for Pedestrian Level thermal comfort (Wall Effect) • Single Building Envelop design - Climate Assessment for Natural Ventilation(20 to 25 degree Celsius, 20 %to 70% RH) - Building envelop design for its climate types (Require Shaded veranda, Cross Ventilation, Ventilated roof space) - Ventilation types for building design (by wind pressure difference and stack effect)
Literature Review Methodology Review: • Assessment Area for CFD • Indicator for Air Ventilation: - Wind Velocity Ratio (including SVRw and LVRw) - Retention time (Tr) “the time for the pollutant released at street level to reach e-1(36.7%) of its original value, were computed from the history of tracer gas concentration following removal of a controlled tracer release. ” • CFD software • Other Aid for Planning - VASARI, FLUIENT, PLAM, PHOMENICS, TAS - AirPAK, Autodesk CFD - Wind Tunnel, MISKAM, Digital Elevation Model(DEM), DIWIMO, KALM, STREET, MLuS-02, PROKAS
Literature Review Technical Design Guideline: • Design Guideline Review in China mainland China'sEcological Construction Residential Technology Assessment Manual which issued in 2011 and Green Building Technology Assessment System which issued in 2003 explicitly mentioned, ensure more than 75% of the plate construction have maintained 1.5 Pa pressure difference in summer, to avoid portioned whirlpool and dead ends, in order to make sure the effective natural ventilation in the indoor environment.
Literature Review • Design Guideline Review in Hong Kong • Hong Kong Urban Climatic Map and Standard for Wind Environmental – Feasibility Study • Urban Design Guideline Chapter 11 • BEAM Plus for New building • The Sustainable Building Design Guideline APP-152
Project Background Address: No. 751, Nathan Road, Price Edward District, Kwun Ngan House, Price Edward Rd W, Kowloon City. Longitude: 114’10 Latitude: 22’19 Elevation: 31m Lot Area: approximately 239 square meters, with the wide about 10.8 meters and length 22.2 meters. Building Height: 48.6 m Floor to floor height: 3.25 m
Original Accommodation Arrangement: Fig.6 Original Ground Floor Plan Fig.7 Floor Plan above the ground Floor for good storage Fig. 9 Changed Standard Floor Plan (in reality) Fig.8 Original Standard Floor Plan (on paper)
Hypothesis How to design the building envelop on this site, to achieve the thermal comfort at the pedestrian level? If more buildings in the high density area could provide more building permeability, especially near the pedestrian, and the permeability space two adjacent buildings could be linked together, it may be able to achieve a breeze way without changing the street pattern which would be harder and requires more times. How to improve the probability of wind for the flat external layout to achieve the cross ventilation? If the redesign proposal could provide more scattered external flat Layout at the same time while making the more permeability in the building, it may be able to allow the wind to reach more facades of the units, in order to achieve more probability for the wind to penetrate the units, even achieve the cross ventilation for all units.
Methodology Study Areas The street where the study project located, its street pattern is the most problematic, almost 90 degree to the annual prevailing wind direction, more than 30 degree to the annual prevailing wind direction. Source: Urban Climatic Map and Standards for Wind Environment – Feasibility Study
Field measurement : Fig.14 Testo 400 Indoor Air Quality IAQ / HVAC Monitor Source: http://ashtead-technology.com Field Measurement Data Analysis: Due to the suitable temperature for natural ventilation is 20 to 25 degree Celsius , suitable relative humidity for natural ventilation is 20% to 70%, compared to the measurement data, the temperature and relative humidity inside the unit are suitable for natural ventilation in spring at Hong Kong, expected for the relative humidity in rest room is a little too high. The wind environment is poor inside the unit.
Deep interviews of attendance: Design consideration respond to the requirement in the interview, • Balconies for hanging clothes are demanded to be design, but the balcony space should not be a reduction of the utility rate. Garden is demanded in the design, and the day lighting access is essential for resident as well. For the most problematic, poor ventilation should be improved. • Garden space with balcony function should be considered in the design, considering the utility rate, these part of space should be limited public space which shared by limited residents. • The building should be more permeability for the air movement to improve the external ventilation of the building, in order to provide more opportunities for the internal air ventilation.
A Performance Based Air Ventilation Assessment (AVA) Methodology Fig 19 Performance Based AVA Methodology Source: Police and technical guideline for urban planning of high-density cities – air ventilation assessment (AVA) of Hong Kong
MM5 Wind Modeling Fig.21 Site Wind Availability Map of Hong Kong Fig.22 Study Site Location Fig.23 Wind Rose in 16 Direction of the study site Table 13 Wind Probability Table Source: Hong Kong Planning Department
CFD Wind Tunnel simulation Vasari Wind Tunnel Tool in Project Vasari will be used in this study to resolve the meteorological wind availability data to site wind data by simulation. But Its limitation is the accurate quantitative results are not available for output, which limited its usage to quick, initial, directional studies only Fig.25 Vasari Wind Tunnel Tool
Case Study ECOTECT Weather Tool Analysis Compared Fig.37 and Fig.38, we could tell the improvement result for the thermal comfort of natural ventilation contributed more than 90% in the whole multiple passive strategy which including passive solar heating, thermal mass effect, exposed mass & night-purge ventilation, natural ventilation, direct evaporated cooling, indirect evaporated cooling. Fig 36. Passive strategy analysis Fig.37 Multiple Passive Strategy Result Analysis Fig.38 Natural Ventilation Result Analysis
Design Task 1: Flat Layout Redesign for the Cross Ventilation • Use Weighting Method to acquire the V infinity fro 16 directions: Fig.23 Wind Rose in 16 Directions at 598m of the study site Fig. 48 V infinity at 598m from16 directions of square 27,27
CFD simulation for site wind probability for the flat layout Though the annual prevailing wind at 598 meters is from the direction of 247.5 degree (East to North 22.5 degree) which the wind velocity of 8.92 meter/s.
Metris of the design proposal 1 for external flat layout: Original: Proposal 1: Fig. 54 Redesign Flat Layout Function Analysis Fig. 52 Original Flat Layout Function Analysis Fig. 53 Detail Original Flat External Layout • Increase more wind probability to reach • more facade of the units • Reduce Room Depth and Increase Flat Height • Corridor Space Control Fig. 55 Detail Redesign Flat External Layout
Design Task 2: Building Envelop Redesign with Air Ventilation Assessment • Initial Design Proposal to be test: Original Building Model: Initial Design Proposal: Fig. 59 Redesigned Building Model in the district Fig.58 Original Building Model in the district
Identify the Assessment Area for AVA A radius with 2H of the assessment building height Fig. 61 Assessment Area for the redesigned building Fig. 60 Assessment Area for the original building
Apply the Redesign to more buildings in the same district Remain the same building volume and street Patten Fig. 64 Apply the original building to other buildings Fig. 66 Apply the redesign building to other buildings
Set up the test points for Site Spatial Average VRw (SVRw) • and Local Spatial Average VRw (LVRw) Perimeter test points: Overall Test Points: Fig. 67 Perimeter test points test points for SVRw Fig. 68 Overall Test Points (64 test points) for LVRw
Data Export Accuracy Control in CFD simulation: • Grid Size Ratio: The Grid Size Ratio (Grid size ratio = H2/H1) should be controlled to be no bigger than 1.3, VASARI is applying the structural grids type, all the Grid Size Ratio if the grids in VASARI are 1, which meets the Grid Size Ratio requirement. • Boundary height control: • Data Export Method:
CFD simulation for the original modeling and the redesign proposal 1: Wind Direction: N (180), Wind Speed: 4.24m/s (simulation with 15 more wind directions in paper) Redesign proposal: Original : Key Finding: After confirming with the air ventilation assessment study, better building envelop design with more permeability in the designed building, and applied this method to the surrounding buildings at in the same district, could achieve better air ventilation for the district on the pedestrian level, given the condition that the street pattern in the district remain the same. On the other hand, though more building permeability could encourage the wind to penetrate along the street deeper, but without changing the street pattern, it’s still hard to create breeze way by only providing more permeability for buildings.
Original and redesign proposal 1Wind Velocity data Original: Redesign Proposal 1:
Key Finding for WR • The average wind velocity at pedestrian level for Perimeter Test Points is increased from 2.46875m/s to 3.367188 m/s by the redesign, which has increased 0.898438m/s, about 0.9 m/s. • The average wind velocity at pedestrian level for the Overall Test Points is increased from 2.233724m/s to 3.33607m/s by the redesign, which has increased 1.102346, about 1.1 m/s.
Original and redesign proposal 1Wind Velocity Ratio data Original: Redesign Proposal 1:
Key Finding for VRw • After comparing the VRw data of the original modeling and redesigned proposal, SVRw is increased by about 0.17 from the original design to the redesign, from0.570277 to 0.73757, by applying to other buildings in the same district respectively, which means when redesign the building, and applying this design to other buildings in the same district, could achieve a more positive impact to the wind environment of the adjacent area of the selected site than the original design does. • Whilst LVRw is increased by about 0.23, from 0.577187 to 0.807531186, which means when redesign the building, and applying this design to other buildings in the same district, promotes a better environment for wind penetration on pedestrian level of assessment area than the original design does.
Discussion • Modeling Area for CFD Simulation: Fig. 82 Extended Modeling Area Illustrations (Yellow: Assessment Area, Blue: Extended Modeling Area)
CFD simulation to resolve V infinity to Site Wind data Original Proposal 1
CFD simulation results for Original Model and Proposal 1: Original Model: Proposal 1:
CFD simulation result for Proposal 1 and Proposal 2: Proposal 1 Proposal 2
Limitation • The time for dissertation time is not in summer, there’s no thermal comfort problem in winter, hence the field measurement could not be able to conduct to find the problematic space for the redesign building to apply. Conduct the field measurement and use RayMan software to calculate and identify the problem area, which can only be done in further study to estimate the serious of the problem. • The data of the field measurement inside the unit B were acquired at a short time at September it may not be perfectly accuracy to support the results in a whole year. • The length of the selected site is less than 60 meters, which is in the exclusion for building permeability assessment of APP 152; hence the model could not apply the requirement in APP 152. • For lacking of the detail topography of this site, annual and summer wind rose of lower height could not used for sure in the study, hence the wind rose for resolving could only use the V infinity of 598meters for ensuring all the situation to apply. • As mentioned in the data accuracy control part, for VASARI software could not export the quantity simulation data, the accuracy of the data could only be controlled to 1m/s. Furthermore, the VASARI software is only made for initial, quick design decision, hence, the wind velocity data at pedestrian level would be only used to calculate and compare the VRw data (including SVRw and LVRw) for the original model and the design proposal, in order to select a better design. • Wind stagnant and wind gust assessment would not be included in this study for the data accuracy prospect, as well as the wind velocity and wind velocity ratio in the design practice could not make a compare to the bench mark in the same district. • The test points on the edge were eliminated in the calculation for the modeling area is not enough for those test points to export the effective data; the modeling area is limited in this study.
Conclusion • Better building envelop with more permeability could promote more air ventilation at pedestrian level, than simple wall building. In this case study, the average wind velocity at pedestrian level for Perimeter Test Points is increased about 0.9 m/s, the Overall Test Points is increased about 1.1 m/s. SVRwis increased by about 0.17, LVRw increased by about 0.23 by the redesign, but breeze way is not able to create by applying the design to other buildings in the same district, given the street pattern remains the same. • More wind probability could be achieve for a more scattered external unit layout.
Further Study For the design practice, building envelops and flat layout design only focus on the external design, for the air ventilation assessment and cross ventilation respectively, the internal design for the building envelops for the considering by stack effect and the detail internal flat layout with quantity technical guide for the cross ventilation would be the extended topic for the further study.