Download
1 / 34
350 likes | 571 Views
Child Psychiatry Research Methods Lecture Series. Lecture 8: Issues in MRI and fMRI Analyses. Elizabeth Garrett esg@jhu.edu. Analysis of Imaging data. New, exciting area of research: growth (partly) due to increases in computer technology for handling data. ENORMOUS amount of data

E N D
Child Psychiatry Research Methods Lecture Series Lecture 8:Issues in MRI and fMRI Analyses Elizabeth Garrett esg@jhu.edu
Analysis of Imaging data • New, exciting area of research: growth (partly) due to increases in computer technology for handling data. • ENORMOUS amount of data • Two areas we will discuss today • Volumetric MRI • Functional MRI • Today’s talk will be “tip of the iceberg,” just to introduce some issues in statistical inference associated with imaging data. Very “low” on the quantitative scale.” • Other related topics • MR Spectroscopy (MRSI) • Diffusion Tensor Imaging (DTI)
Preface Two types of “analysis” that we hear about in MRI and fMRI studies: (1) analysis that converts the readings from the MRI to “data”. This process is time intensive and takes a trained expert. There are multiple outputs from this process, including 3D pictures, volumes, intensities, etc. (2) analysis that uses the “data” from part (1) in a statistical way to answer scientific questions. We will discuss ONLY (2). (1) is a whole other can of worms.
MRI: 3D image • Intuitively, we are used to interpreting scans (like x-rays) qualitatively, not quantitatively. • Example: • Consider a “cube” in the brain of only 10 by 10 by 10 voxels. • That is 1,000 data points! • Data storage and data management gets costly • Efficient methods are needed for dealing with this type of data. • Statistical analysis requires data reduction.
How do we quantify differences? • Volumetric MRI • Typically, we compare relative volumes of different areas of the brain • Example: Paula Lockhart’s comparison of children with Fetal Alcohol Syndrome (FAS) and controls (ADHD or “normals”).
How do we reduce dimensionality? • Calculate “volumes” for each area of interest. • Normalize to the overall volume (?) • For each area, you have one number describing the area. • Can compare areas in FAS kids to control kids. • We can do this using simple statistical tools we already know.
Hypothetical results for cerebellar vermis volumes • 20 FAS kids: mean = 400, s.d. = 75 • 20 Control kids: mean = 450, s.d. = 68 • t-test: (degrees of freedom = 20 + 20 - 2 = 38) pvalue = 0.033
Key Idea: Data REDUCTION • In Paula’s example, a huge amount of data was reduced to one number for each child: volume of cerebellar vermis. • Other outcomes may be of interest • Remember: • The statistical methods are not the hard part: the hard part is summarizing an MRI. • Can’t say that things are “different” by visual inspection. Too subjective, although it might seem clear-cut. • Converting from photos/scans to data takes a lot of space! Think about how much information you would need to try to reproduce a digital photograph and a photo is only 2 dimensions! A picture is really worth MORE than 1000 words. • Try to choose measures that are as objective as possible. • In embarking on an MRI study, you need someone who REALLY understands “(1)” (from preface) to be involved.
Analyzing Functional MRI (fMRI) • All of the issues in MRI analysis are also issues in fMRI analysis • But, fMRI is MUCH more complicated! • Why? • Functional: shows how brain responds to stimulus over time. • Not just a 3D picture of the brain, but a 3D image of how the brain is “lighting up” over multiple time points.
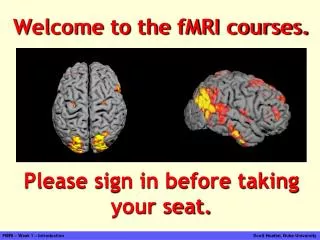
Figure 1. fMRI of picture naming in a normal control, p<0.01, demonstrating prominent left temporal, left posterior frontal and right peri-Rolandic activation, overlaid on T1 images. TR/TE = 1sec/50msec, flip angle 70, 7 mm slices, image matrix 64x64. Example of “lighting up” Moo and Hart, 2000
“Easy” Example of Modeling fMRI • Design of experiment: • light turns on. • 10 seconds off, 10 seconds on, 10 seconds off…. • Assumption: • areas that are activated will look like this: “boxcar”
How to figure out where “boxcar” occurs? At EACH voxel, plot intensity versus time:
Assess statistically the “boxcar” model at each voxel Perform a regression to see if activation is different when light is on versus off: Voxel i Time t
Voxel 4235 Coef Se t p on 0.024 0.014 1.70 0.09 _cons -0.01 0.009 -1.11 0.27 Voxel 947 Coef Se t p on 0.99 0.014 70.39 <0.001 _cons -0.007 0.009 -0.78 0.44 Regression Results
Now what? • Say you look at 2000 voxels. • Then, you have 2000 t-tests….how can we summarize them? • Consider image: • you can plot the significant voxels (see image) • look at different areas of the brain • look for “patterns” of activation • for example, • If you find that only voxel “lights up” in the in an area, that is likely not an interesting finding. • If you find that a large proportion of voxels in an area in close proximity light up, then you have found something interesting.
Focus in the previous example • Area of activation • If t-test for 1is “significant,” then we say that the voxel is lit up. • We ignore HOW lit up it is, just that it is lit up. • This example has focused on trying to assess AREA of activation.
Alternative approach Consider intensity of activation p < 0.001
Intensity of Activation • In both voxels, activation was “significant.” • But, in voxel 947, the level of activation was much higher. • We may be more interested in voxels that show greater intensities. • Consider image: see high intensity in the center of an activated region, tapering as move away from center.
Using data from multiple subjects • Add a random intercept/effect for each individual. • For each voxel, you are averaging across many of the intensity plots like we saw in previous slides. Voxel i Time t Subject n
Longitudinal fMRI Studies • How does function change in degenerative disease, such as multiple sclerosis? • Can use linear regression again. • Consider previous example • what if they aren’t too different voxels, but two different time points? • How do we assess if function, within a voxel, is deteriorating over time, quantitatively?
Longitudinal Model with One Subject Voxel i Time t Year j
Longitudinal Model with Multiple Subjects Voxel i Time t Subject n Year j
Things to consider in fMRI studies • Area of activation and intensity of activation are the usual outcomes of interest. Must specify! • Complicated tasks are hard to analyze • already established: finger tapping, light on/off • still under investigation: Go - No Go • Multiple subjects • Method (i.e. linear regression) translates nicely to multiple subjects • recall repeated measures and longitudinal analysis • include a subject-specific adjustment and data from across individuals • can be analyzed simulataneously. • Longitudinal Analyses • Not that much more difficult conceptually than the multiple subjects example • Data management issues are the limiting, complicating factor • When longitundinal data AND multiple subjects, need to consider variance structure (not addressed today). • Study design is critical in these experiments: number of subjects, tasks chosen
Biostatistical Resources and Further Studies • Biostatistics Consulting Center: • In the biostatistics department, SPH. • http://www.jhsph.edu/biostats/consulting.html • fMRI journal club (for serious fMRI stuff): • fmri_jc@yahoogroups.com • Psychiatric Neuro-Imaging people
Biostatistics Courses • Biostatistics 611-612: • Provides the basic tools for reading medical literature. • Focuses on understanding the terminology (e.g. pvalue, odds ratio, regression), and very little on equations. • 2 terms (one semester) • summer epi institute (3 weeks intensive) • 1st and 2nd terms • If you want to understand statistics at a “reading” level, but never want to do data analysis, this would be the course for you.
Biostatistics Courses • Biostatistics 621-624 • Provides tools for performing data analysis. More in depth and hands-on than 611-612 • Data analysis using Stata • 4 terms (can take fewer) • 2 sections, both beginning in 1st term. • If you want to be able to do your own statistics, sample size calculations, etc. but do not want to get overly involved in the “mathy” aspects of statistics, this is the course for you!
Biostatistics Courses • Biostatistics 651-654 • Calculus-based statistics • Only for those who want to REALLY understand statistics • 4 terms, 1 section, beginning 1st term. • Learn everything from 621-624, but in more depth. • Only take this course if you are a strong math student and calculus is “fresh” in your mind.
Other related courses offered at JHMI Clinical Research Methods • 2 weeks intensive (9-5 every day) • Epi and biostats • “This full time course is intended for clinical post-doctoral fellows and junior faculty of the School of Medicine.” • www.jhsph.edu/gtpci/icc.html Science of Clinical Investigation • 4 courses taught in sequence throughout the academic year. • Each course consists of approximately eight three-hour sessions held on consecutive Monday evenings from 5:30-8:30 PM. • Goal: To enhance course participants' theoretical understanding of and practical skills in the design, implementation, analysis, and interpretation of data from clinical investigations. • http://www.jhsph.edu/gtpci/cis.html