Download
1 / 35
350 likes | 536 Views
DIAGNOSTICS IN INDUSTRIAL REACTORS. WHY DIAGNOSTICS (sensors) ? Structure of a semiconductor production plant Financial aspect Trend and consequence for plasma diagnostics PLASMA DIAGNOSTIC IN PRODUCTION Role of a sensor in a system Different levels of warning

E N D
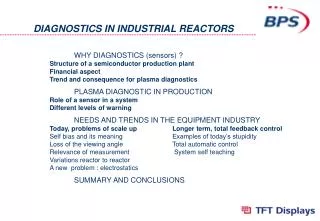
DIAGNOSTICS IN INDUSTRIAL REACTORS WHY DIAGNOSTICS (sensors) ? Structure of a semiconductor production plant Financial aspect Trend and consequence for plasma diagnostics PLASMA DIAGNOSTIC IN PRODUCTION Role of a sensor in a system Different levels of warning NEEDS AND TRENDS IN THE EQUIPMENT INDUSTRY Today, problems of scale up Longer term, total feedback control Self bias and its meaning Examples of today’s stupidity Loss of the viewing angle Total automatic control Relevance of measurement System self teaching Variations reactor to reactor A new problem : electrostatics SUMMARY AND CONCLUSIONS
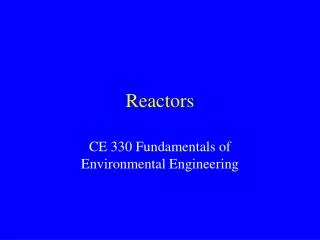
oven oven control control control oven R R R Yellow room for PHOTOLITHOGRAPHY Resist spinning Soft bake Exposure etc….. PVD R oven R R PECVD ETCH R R R R ETCH R PECVD R WET ETCH ETCH R R R PECVD WET ETCH ETCH R R R R WET DEVELOPER ETCH R R R PVD R WET CLEAN ETCH R R R STORAGE AND TRANSFER PVD R Possible architecture of a plant plasmas
control control control oven R R R oven oven AGV Yellow room for PHOTOLITHOGRAPHY Resist spinning Soft bake Exposure etc….. PVD R oven R R PECVD ETCH R R R R ETCH R PECVD R WET ETCH ETCH R R R PECVD WET ETCH ETCH R R R R WET DEVELOPER ETCH R R R PVD R WET CLEAN ETCH R R R STORAGE AND TRANSFER PVD R Example of a fraction of process flow
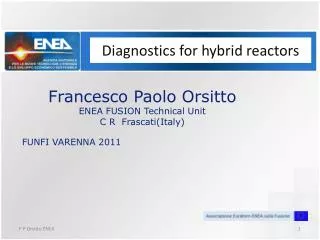
Unit selling price Price decay a. u. Return on investment 0 Factory output 100 % reject PRODUCTION YIELD Ramp up Delivery time 0 1 year time Financial aspect Investment from 0.5 to 1 billion US $ !
Unit selling price Price decay a. u. Return on investment 0 Factory output 100 % reject PRODUCTION YIELD Ramp up Delivery time 0 1 year time Financial aspect
TRENDS IN THE ELECTRONIC INDUSTRY Investment isGIGANTIC Process is veryCOMPLEX Main keys to success : DELAY(very short) YIELD(very high) Consequences on equipment choice : NO RISK- proven technique preferred - long delay for introducing innovation (probation phase) - simple and stupid far better than sophistication CONSISTANCY MORE IMPORTANT THAN PERFORMANCE - production scale up based on “copy and paste” - process and equipment should work in “robust” zones - equipment : long MTBF and short MTTR MTBF = Mean Time Between Failure, MTTR = Mean Time To Repair
PLASMA DIAGNOSTIC IN PRODUCTION Main consequences for diagnostic & sensors attached to the plasma production tools RELIABILITY : - the sensor must be a source of improved reliability - the sensor should not interfere with the process - sensor failure should not jeopardise the benefit related to the presence of the sensor. - simple and stupid is always a winner - smart and complex sent back to development PRODUCTION WORTHY - ideally the sensor should give an early warning that the process is drifting away from its optimum before the product is out of its specifications. - however false alarms are strictly forbidden. - the understanding of physics is irrelevant, what counts is that the sensor sensitivity and its “correlation” with process “quality”.
PLASMA DIAGNOSTIC IN PRODUCTION WARNING This paper is (on purpose) provocative to the scientific community. Hence what is stressed is what scientist are not already familiar with. PLEASE REMEMBER It needs sometimes far more genius to implement something “stupid and simple” instead of a sophisticated and complex measurement. Speaking of reliability or yield, it generally takes as much work (and creativity) to go from 50 to 98 % than to go from 98 to 99 %. Unfortunately the business margins are in the last % points !!
THE 3 ROLES AND LOCATIONS OF A SENSOR PLASMA SENSOR To next process 1) REMOTE POST PROCESS ANALYSIS Not a real plasma sensor, analyses the result Touching the substrate is usually forbidden Optical technique (reflectometry, ellipsometry) Still very effective if fast and reliable Allow s an early stop of defective substrates Can detect process drift if sensitive enough Gives only one value (or one set of value) per run.
THE 3 ROLES AND LOCATIONS OF A SENSOR PLASMA SENSOR 2) REAL TIME CONTROL OF A PARAMETER Measures one process parameter. Needs not to perturb the process (watch out for window or probe perturbation) Possibly analyses the substrate (reflectometry) Possibly analyses the plasma (probe, RF voltage, etc…) Possibly analyses the gas phase (pressure, QMS, etc..) Possibly analyses a combination (OES, self bias, etc…) Can detect process drift if sensitive enough Trade off needed between number of data and memory size Gives a full time sequence of measurement per run
THE 3 ROLES AND LOCATIONS OF A SENSOR Input parameter (End point detection is part of this case) Feed back controller PLASMA SENSOR 3) FEED BACK CONTROLLING SENSOR Similar as case 2) but also : The sensor is used to stabilise the process At least one process input parameter is automatically varied to keep constant the measurement of the sensor. Some examples : Match box tuning (Reflected RF / 2 setting of match box capacitors) Pressure control (pressure / throttle valve) The offset of the sensor (departure from set point) can be recorded as process data
Analogic feedback ELECTRONIC PART SENSOR AMPLIFIER SIGNAL PROCESSING COMPARISON SAMPLING Digital feedback Comparison to thresholds PREFERABLY DATA COMPRESSION WARNING DATA PROCESSING CENTRAL DATA STORAGE to plant CPU TEMPORARY STORAGE SYSTEM PROCESSOR WHAT TO DO WITH THE DATA ?
LEVELS OF WARNING FROM A SENSOR A process controlling sensor should have several levels of warning depending of the departure from the set point SENSOR OUTPUT IMMEDIATE STOP Defective system Stop at the end of the run Product in process are not qualified Product still OK Warning message System check-up to be planned as soon as possible OK Central value
Gas flow offset Set point Delay for repair time Everything is OK Early warning, production is still OK, maintenance to be scheduled Production is out of specification. Substrates to be rejected EXAMPLE : MFC DRIFT Mass Flow Controllers, when handling highly reactive gases and vapours, are among the most sensitive subsystems in plasma processor. Usually they do not break, they drift. An erroneous gas mixture can bring thin films out of specifications (leaky insulator, wrong taper).
controlled temperature Calibrated narrow pipe Pcal MFC MFC MFC GAS 1 Flow = Cste Pcal 2 GAS 2 GAS 3 IMPROVING PROCESS SAFETY :double checking
NEED AND TRENDS IN THE EQUIPMENT INDUSTRY Note : the point of view expressed here is mostly related to the Display industry, however some of the long term trends are also valid for the semiconductor industry. SHORT TERM Cost issue :- Added value per unit surface, sensor cost Basic questions :- Interpretation of a sensor drift Substrate size issue :- Optical measurement and viewing angle - Self bias (meaning of the measurement) Reactor to reactor :- difference between 2 reactors LONG TERM Feed back control :- Status of today - Some possible improvements - Long term future Sensor research :- Relation to process results - Multi-step processes - Data compression
REQUIRED CLEANINESS TYPICAL PROCESS TIME (sec.) Window pane (particle/m²) 1000 Solar pannel 10000 100 AMLCD 1000 IC 10 Disk storage 100 1 (Yen/cm²) 1 0.1 10 100 (m²) 0.01 0.1 1 10 SUBSTRATE UNIT SIZE ADDED VALUE PER STEP SENSORS : Cost issue
SENSORS : Cost issue The Display Industry will not grow unless it learns how to produce at low cost, same goes for the solar cell industry. The Semiconductor Industry is gradually becoming a low margin business (pressure from far east countries). Equipment suppliers are being transmitted the cost squeezing pressure : system “cost of ownership” shall drop down COO = COST PER UNIT PROCESS IN PRODUCTION = ( Yearly amortisation / Yearly throughput) + gasses + electricity + water + other fluids + man power + maintenance + floor space rental + yield decay due to this system The investment cost of a system is not related to the weight or the steel work, but is rather related to the complexity of the system (electronic and electric, interlocks, software, troubleshooting, etc…). Sensors can make a definitive impact on system complexity. Stupid & simple more than ever the best choice !
constant sensor maximum variation Marginal Process parameter 2 OK BAD Process parameter 1 RELATIONS PROCESS-SENSOR The ideal sensor gives a signal which varies with the maximum sensitivity with process quality. The relation can be experimentally established by optimised orthogonal planning (work intensive). In the attached figure, the process parameter space is only 2-d. It is usually much higher dimension. Example of process parameters : - RF power, match box setting - Pressure, gas flow and composition - Temperature Attention “quality” can be also a multiple parameter concept. There is no need to understand the detail of the physics in the relation between sensor signal and process quality. It is more important not to neglect “hidden” parameters (purity, substrate history, etc.). the process “quality” is shown in the colour scale
Substrate diagonal in meter 950 x 1100 1.4 FINAL? 3rd generation 1.2 700 x 850 650 x 750 1 550 x 650 2nd generation 0.8 1st generation 400 x 500 350 x 450 0.6 300 x 300 0.4 largest wafer 1980 1990 2000 Years ISSUES RELATED TO SUBSTRATE SIZE Trend in the Display Industry
ISSUES RELATED TO SUBSTRATE SIZE self bias : sensitivity and interpretation (1) DC Voltage measurement RF filter RF PLASMA Matching network Self bias: good example of “stupid & simple” - Easy to implement - External to the process zone - Varies with “some” process parameters Self bias is universally used in RF plasmas Still used for probing display processing What is the meaning of self bias ? RF GENERATOR
ISSUES RELATED TO SUBSTRATE SIZE self bias : sensitivity and interpretation (2) VRF VRF Vbias SHEATH (electrode) C Selectrode SHEATH (electrode) SHEATH (g.) Vplasma Vplasma SHEATH (ground) SHEATH (ground) C Sground Equivalent circuit in blue : RF component in cyan : DC component SHEATH Voltage Vplasma average Ions+ Vplasma electrons
VRF Vbias Se e Ve Ve Vplasma Vplasma g Vg Vg Sg Ve Ve Sgn Vg Vg Se in blue : RF component in cyan : DC component withn = 1 / (1-) (practically n = 1.6 - 2.2) ISSUES RELATED TO SUBSTRATE SIZE self bias : sensitivity and interpretation (3) Plasma sheath = vacuum capacitance = equivalent thickness with V Sheath rectification implies that : Ve ½ Ve(peak to peak RF voltage) Vg ½ Vg Constant RF current CeVe = CgVg hence SeVe / Ve = SgVg / Vg
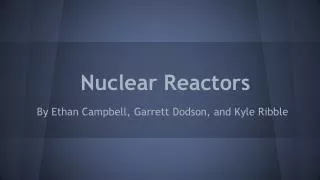
1 1m² glass 1 m² GLASS 0.5 Vbias/(½VRF) wafers 0 -0.5 1.5 1 0 0.5 R or (Se / Sg) ISSUES RELATED TO SUBSTRATE SIZE self bias : sensitivity and interpretation (4) Vbias = Vg - Ve = ½ (Ve - Vg) = ½ VRF (1-Rn) / (1+Rn) with R = Se/Sg (relative electrode surface ratio) WAFER For R 1 , Vbias is a function of both VRF and R the surface ratio. Before is was just ½ VRF Vbias becomes a less “simple” tool
ISSUES RELATED TO SUBSTRATE SIZE self bias : sensitivity and interpretation (5) Equivalent circuit RF Plasma Dust grain below the substrate The series capacitance of the substrate changes the sheath capacitance of the ground, hence it modifies the equivalent surface ratio. If a dust grain is below the substrate, the substrate capacitance is modified, a change is seen in Vbias. If a Vbias drift is observed, shall we change the RF generator for calibration or open the reactor for cleaning?
ISSUES RELATED TO SUBSTRATE SIZE self bias : sensitivity and interpretation (6) Vbias as a plasma monitoring tool is so popular that people are still using it in the RIE etching of insulating substrate. Question : what is the meaning of such a measurement when all the electrode is protected from direct exposure to the plasma to avoid sputtering of the metal? Sacrificial quartz liners RIE ETCH PLASMA to Vbias measurement FILTER RF The measured signal is due to the faint plasma which penetrates in the electrode/ground gap. One may wander about effects such as geometry, thermal expansion, surface oxidation, electronegative gases, etc.. Again it is clear that self bias gives an information with value (it is even used as an end point), but the open question is how to interpret signal level variations, drift, etc..
Holes in the electrode impossible or very difficult < 2° 1 cm 1 m Line filter Sensor ISSUES RELATED TO SUBSTRATE SIZE Viewing angle The plasma gap cannot be varied : the process which was qualified with smaller substrate must be preserved 2 severe problems : - incidence angle is very small, reflectometry or ellipsometry are not at their best. Technology to be revisited. -the optical aperture is very small, non coherent sources are difficult to use. This optical etendue problem is also an issue for local analysis of the plasma spontaneous emission. During process, part of the analysed light emission is reflected on walls. The reflection coefficient is modulated by the film thickness variations. The signal is found to vary while the plasma is stable. This oscillation would have some value if the reflection angle was well defined, but the solid angle would need to be very small and the signal would be very weak.
REACTOR TO REACTOR VARIATIONS KAI : Parallel processing PECVD production system (20 identical reactors in parallel). Ideally they should provide identical results. In reality they give an excellent +/- 3% reactor to reactor thickness variation for SiN deposition. Note that this level of variation is of the order of the the uncertainty of the sensors attached to each reactor. However after very careful analysis and cross-correlation we have identified, for this specific SiN process, what is responsible of the 3% box to box average thickness variation : - about 1% is due to gas flow variation (well related to the accuracy of our gas flow divider) - about 1% is related to the RF generator calibration accuracy (made on a 50 resistive load) -about 1% is related to the reactor capacitance fluctuation (match box losses)
RF Match Box Large resonance RF current REACTOR TO REACTOR VARIATIONS RF power distribution OHMIC LOSSES IN MATCH BOX & FEED THROUGH PLASMA 50
Match Box in : RF reflected power out : capacitor setting RF generator in : RF power out : gain setting M B MFC in : thermal differential out : valve setting Generator Temperature in : thermocouple out : heater current Pressure in : capacitance gauge out : valve setting FEED BACK CONTROL IN PROCESS SYSTEMS Classical feed-back sub-system units found today in most standard process equipment
FEED BACK : present status These independent feedback loops are actually interacting via the plasma. In some cases, this interaction can result into long relaxation time , even instability Example : Pressure regulation versus match box Reflected RF Process exhaust flow (for one given match box setting) 0 0 Effective RF power Pressure Effective RF power Exhaust gas flow Process pressure Plasma impedance Reflected RF power Match box adjustment Both pressure control and match box setting are coupled via the plasma response. If the gain of the feedback loops is too large and for some parameter coupling configuration, the ensemble can ring and offer very poor control. All this can be stabilised by proper setting of the PID.
Vacuum Gas in Plasma “on” Hot plate heat loss gas cond. plasma power PLASMA radiative 0 Target temperature Temperature Standard feedback Heater power FEEDBACK SYSTEM Improved method FEED BACK : present status
SENSORS computer DRIVERS LONG TERM : Multiple feedback Modern fighter planes, Most advanced robots are driven by multiple feedback from a simple central unit The central unit computer must be a fast real time unit. Such units are today available on the market (originating mostly from the military market)
Input parameters Sensors & diagnostics PROCESS Controlled parameters Real time computer Process quality rating LONG TERM : Multiple feedback The computer establishes the process result as a combination of sensor measurement, then detect the differential from optimum, finally it calculates the variations of all control parameter settings in order to bring the process as close as possible to its optimum process point.
PROCESS LONG TERM : Multiple feedback Necessary conditions for multiple feedback implementation - Drop the individual sensor + feedback concept. - Relation process quality / sensor response must be known - Sensors must be absolutely reliable One finds here again the main issues related to sensor/diagnostics in industrial environment Such a system can define its best response by self-learning : The response of all process component is analysed for a step like perturbation of all input parameters, including the controlled parameters. The system response is locally linearized and the response calculation is similar to a matrix inversion logic.