Download
1 / 13
140 likes | 381 Views
Color Blindness. Nancy Paguay & Zinani Harriot 2/1/2010 Period. 9/10. Summary of Genetic Disorder. Are You Color Blind!?!?!?!. http://www.nlm.nih.gov/medlineplus/ency/imagepages/9962.htm

E N D
Color Blindness Nancy Paguay & Zinani Harriot 2/1/2010 Period. 9/10
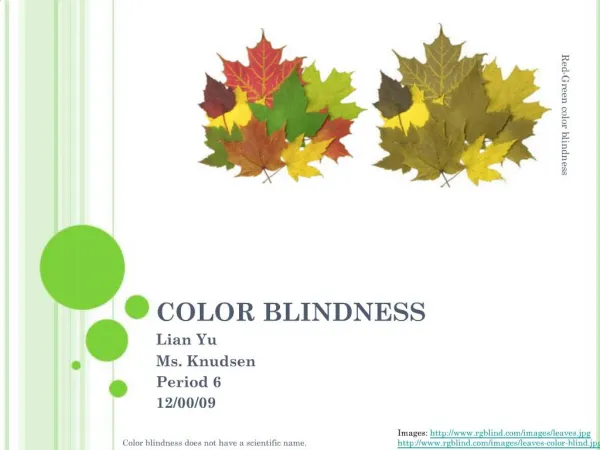
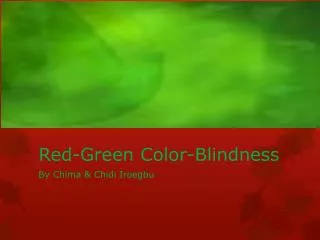
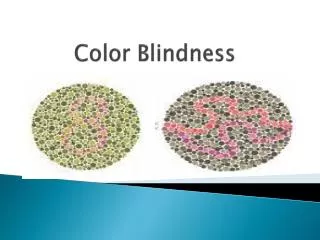
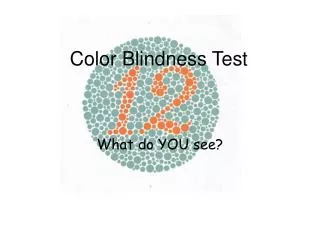
Summary of Genetic Disorder Are You Color Blind!?!?!?! • http://www.nlm.nih.gov/medlineplus/ency/imagepages/9962.htm • This genetic disorder affects the perception of color. There are some cases that may be a very mild difficulty of seeing colors, while others have a total difficulty with seeing any color. • symptoms: • trouble seeing colors and the brightness of colors in the usual way • incapable of noticing the different shades of the same or similar colors • Interesting Facts: • 3 types of color blindness • most common is red-green vision defects. This type occurs more in men than in women. The other two are blue-yellow and complete absence of color vision.
What chromosome is your disorder located on? May be more than one. Include a picture
Mode of Inheritance • How would one acquire the genetic disorder? (Yours may be sex linked, autosomal recessive or autosomal dominant) • What does sex linked/x-linked, autosomal recessive or autosomal dominant mean? (What does autosomal refer to and what does recessive/dominant refer to? What does “sex linked/x-linked)” refer to?) • If your disorder is not well understood, explain. • If the disorder has other modes of inheritance, explain.
Explain what alleles are. How many alleles does each person have per gene Where they come from How we represent recessive or dominant alleles -RR, rr, Rr What is dominance and recessiveness? Sex linked (x-linked) is represented with XR, or Xr, or Y
Make a punnett square to demonstrate the probability per child depending on the parents Make more than one punnett square. Parents determine the ratio of probability of offspring having the genetic disorder. Explain(see below) to the class how the punnett square works. Female is on the left and father is represented on the top. *** Each punnett square represents the probability PER CHILD. Not all of the children parents may have. *** • homozygous dominant • heterozygous dominant • homozygous recessive
Use the same punnett square model to… homozygous dominant:heterozygous dominant:homozygous recessive 1 : 2 : 1 1GG : 2Gg : 1gg Explain probability using: Ratios (must equal 4 because there are 4 possibilities) Percentages (must equal 100 because there are 4 possibilities 25% each) homozygous dominant:heterozygous dominant:homozygous recessive 25% : 50% : 25% 25%GG : 50%Gg : 25%gg
Use the same punnett square to use as your model to explain… • What these letter mean! GG? Gg? gg? • Phenotype(what you SEE) • GG= GREEN • Gg= GREEN (yellow gene carrier) • gg = yellow • Genotype(what is in the GENES) • GG= Homozygous dominant (GREEN) • Gg= Heterozygous dominant (GREEN) • gg = homozygous recessive (yellow) If G represents the dominant allele GREEN and g represents the recessive allele yellow, then we can assume that:
Use the same punnett square model to… • Explain Genotype and Phenotype probability using: • Phenotype • -Ratios- 3 GREEN : 1 yellow • - Percentages- 75% GREEN : 25% yellow • Genotype • - Ratios- 1GG : 2 Gg : 1 gg • - Percentages- 25% GG: 50% Gg : 25%gg
Student PracticePunnett Square PracticeYou provide genes for the students: only parents and student fill in the box genotypes and phenotypes Genotype: Ratio: Percentage: Phenotype: Ratio: Percentage: • When the students are finished, ask them to share their answers with you. Use the custom animation option to hide the answers until students have shared theirs with you.
Autosomal Recessive X-linked Autosomal Dominant Lastly, a 3 generation hypothetical Pedigree White= Person is fine. May possibly carry the recessive “bad gene.” Can have one “health” and one “bad” gene of two “healthy genes.” Black= Person is affected. Has 2 “bad” genes. Circle = female Square = male All White= homozygous recessive gene, person is fine, has 2 copies of the “healthy” gene All Green= homozygous dominant, person have disorder and 2 copies of the “bad” gene Half Green/Half White= because this is a dominant disorder (rules of dominance), the person has the disease and only has one copy of the “bad” gene and one copy of the “healthy” gene. Color gene is “bad” on x chromosome Color gene is “healthy” on x chromosome Color gene is “healthy” on x chromosome One gene is “bad”, one gene is “healthy” on the x chromosome Female is fine. 3 generations, (I: two parents II: 3 children and two spouses III: 4 children, any combo ( explain how to READ your punnett square)
Student Practice(you provide generation I, 2, and 3)Show a pedigree like this, but you fill in the rest using a different sample than the previous page. You choose male and female, who is married to who (you have to add 2 spouses, and who has children in the Generation III. Example: ***Make a key: circle= square= shaded in= not shaded in= half shaded in= I II III Example: ***Ask 3 questions (type them on this page) to make sure the students can analyze a pedigree. (NO yes/no answers) 1. 2. 3.