Download
1 / 24
240 likes | 375 Views
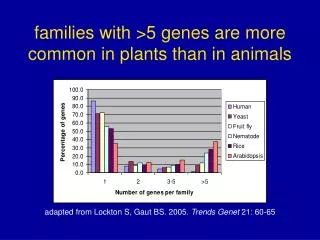
adapted from Lockton S, Gaut BS. 2005. Trends Genet 21: 60-65. families with >5 genes are more common in plants than in animals. Arabidopsis and rice AS.

E N D
adapted from Lockton S, Gaut BS. 2005. Trends Genet 21: 60-65 families with >5 genes are more common in plants than in animals
Arabidopsis and rice AS Boue S, et al. 2003. BioEssays 25: 1031-1034; Iida K, et al. 2004. Nucleic Acids Res 32: 5096-5103; Kikuchi S, et al. 2003. Science 301: 376-379 alternative splicing (AS) is more common in animals than in plants
duplications occur on any length scale, from individual genes (where tandem refers to a gene and its duplicate being adjacent), to multi-gene segments of the chromosome, to an entire genomee.g. wild wheat is diploid 2n, domestication gave a tetraploid 4n (pasta) and a hexaploid 6n (bread)synteny is when 2 or more genes are found in the same order/orientation on the chromosomes of related species
monocot dicot adapted from Blanc G, Wolfe KH. 2004. Plant Cell 16: 1667-1678; Paterson AH, et al. 2004. Proc Natl Acad Sci USA 101: 9903-9908 polyploidy (whole genome duplication) events among plants
Gramineae 55~70 Mya sorghum maize barley wheat rice Arabidopsis monocot-dicot 170~235 Mya phylogeny of the favored plantsthere is extensive synteny among Gramineae but between Gramineae and Arabidopsis there is essentially no synteny
the duplication history of riceevery cDNA-defined gene is assigned a duplication category using the methods of Yu J, et al. 2005. PLoS Biol 3: e38 • analysis relies entirely on 19,079 full length cDNAs; had we used predicted genes instead many of the duplications would have been missed • a homolog pair refers to a cDNA and its TblastN match (i.e. comparisons done at amino acid level to genome translation in all 6 reading frames) at an expectation value of 1E-7 and requiring that >50% be aligned; note that the TblastN match is not necessarily expressed itself • if a gene has any homologs at all, the mean(median) number of homologs is 40(5) • multiple duplications are difficult to analyze; so consider the cDNAs with 1-and-only-1 homolog
whole genome birth recent segmental individual genes time death ONE whole genome duplication, a recent segmental duplication, and many individual gene duplications
segmental 18 pairs of duplicated segments covering 65.7% of rice genomehigher order homologs used to backfill established trend lines
uninterpretable plot if use cDNAs with more than one homolog in ricemean (median) number of homologs per duplicated gene is 40 (5)
background tandem unmarked trend along diagonal from tandem gene duplicationsthere were NO segmental duplications within a chromosome
Ka = non-synonymous changes per available site Ks = synonymous changes per available site available site corrects for fact that 76% of substitutions, or 438 of 3364, encode a different amino acid Ka/Ks < 1 is evidence of purifying selection Ka/Ks = 1 is evidence of no selection (pseudogene) Ka/Ks > 1 is evidence of adaptive selection mean Ka/Ks is 0.20 in primates and 0.14 in rodents computing molecular clocks and indicators of evolutionary selection
Kumar S, Hedges SB. 1998. Nature 392: 917-920 common ancestor species1 species2 time since divergence equals species2-species1 divided by (2 × neutral substitution rate) neutral substitution rates vary with genes and evolutionary lineages but on average they are 2.2×10⁻⁹for mammals and 6.5×10⁻⁹for Gramineae from neutral substitution rate to time since divergence of species
timing of WGD relative to Gramineae divergence is based on observed syntenies and not Ks 17 of 18 segments are attributable to a whole genome duplication just before the Gramineae divergence
peak at zero Ks and exponential decay thereafter is indicative of ongoing duplication process background duplications have Ks signature like tandem duplications except that they are more ancient
one copy left alone post-duplicative ‘transient’ of duration 4~17 million years novel function progenitor gene one copy to modify reduced expression relaxed selection eventual death hypothesis introduced by Lynch M, Conery JS. 2000. Science 290: 1151; with details in Lynch M, Conery JS. 2003. J Struct Funct Genomics 3: 35 duplicated genes undergo periods of relaxed selection and are usually silenced within 4~17 million years
rice analysis succeeded only because duplication is not too oldwhen the duplication is old: an analysis from yeast comparing related genomes with and without the duplicationKellis M, et al. 2004. Proof and evolutionary analysis of ancient genome duplication in the yeast Saccharomyces cerevisiae. Nature 428: 617-624when the duplication is extremely new: an analysis from humanBailey JA, et al. 2002. Recent segmental duplications in the human genome. Science 297: 1003-1007
duplication mutation gene death interleaving genes from sister segments in comparison to K. waltii proof of whole genome duplication in Saccharomyces cerevisiae by comparison to sequence of Kluyveromyces waltii
whole genome shotgun (WGS) reads from Celera are aligned to map-based genome from IHGSC; recent segmental duplications are detected in similarity and read depth anomalies identifying recent segmental duplications in human assembly
recent segmental duplications of length>10-kb & identity>95%; intra-chromosomal (blue lines) and inter-chromosomal (red bars) duplication; unique regions surrounded by intra-chromosomal duplications (gold bars) are hot spots for genomic disorders patterns of intra-chromosomal and inter-chromosomal duplication
proportion of Celera aligned bases falls rapidly as identity exceeds 97% or length exceeds 15-kb, but the total sequence lost is still only 2%~3% NB: search of the map-based rice genome revealed no segmental duplications of recent origins (Yu J, et al. 2006. Trends Plant Sci 11: 387-391 recent segmental duplications in IHGSC and Celera genomes
“Although it is clear that the detailed clone-ordered approach is superior in the resolution of segmental duplications, it would be unrealistic to propose that the sequencing community should abandon whole-genome-shotgun based approaches. These are the most efficient cost-effective means of capturing the bulk of the euchromatic sequence.”Evan E. Eichler (21 October 2004)