Download
1 / 21
220 likes | 475 Views
Chapter 14 Price Discrimination and Monopoly Practices. Figure 14.1 The simple monopoly problem. Price Discrimination and Market Segmentation. All price discrimination schemes share an underlying strategy to segment the market and to charge each segment a different price relative to its cost.

E N D
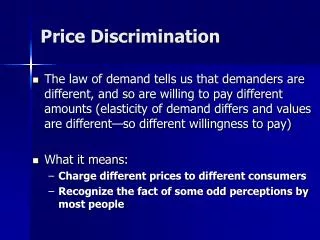
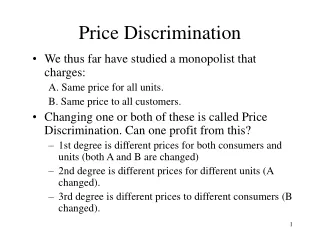
Price Discrimination and Market Segmentation • All price discrimination schemes share an underlying strategy to segment the market and to charge each segment a different price relative to its cost. • The monopolist’s goal is to turn consumer surplus into revenue.
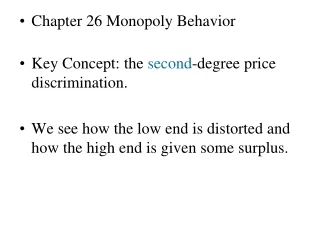
Price Discrimination Categories of price discrimination: • Perfect Price discrimination-successfully extracting the maximum possible profit from each customer and therefore the whole market. • Ordinary Price Discrimination-identification of potential customer groups, charging each group a separate price. • Multipart Pricing-charging different rates for different amounts (blocks) of a good or service.
Price Discrimination • To maximize revenue from the sale of a fixed quantity of output, allocate output so that marginal revenue is identical in all markets.
Figure 14.3 Price discrimination: equality of marginal revenue
Price Discrimination • A profit maximizing monopolist engaging in ordinary price discrimination will choose an aggregate output where (aggregate)MR=MC. • Output is allocated so MR is the same in all market segments. • Price is higher in the market segment with the lower price elasticity of demand.
Price Discrimination • Criteria For Price Discrimination: • The market must be able to identify different price elasticities of demand and segment the market accordingly. • Re-sale must not be possible or cost effective in order to prevent arbitrage (profitable re-selling).
Price Discrimination • Methods of market segmentation: - Direct identification (seniors must show ID to get discounts). - Self selection (advance booking on airlines, stay a Saturday night). - Intertemporal-charging higher prices when the good is first introduced and reducing prices through time.
Monopsonistic Price Discrimination • A profit maximizing monopsonist will choose aggregate quantity of inputs so that aggregate marginal factor cost (MFC) equals marginal revenue product (MRP). • Purchases will be allocated so that MFC is identical in all input markets.
Tie-In Sales • Tie-in sales are another way for a monopolist to extract surplus from its customers. • A tie-in sale occurs when a firm has monopoly over some good X, but refuses to sell it unless you also buy good Y, which is available in a competitive market. • With a tie-in sale, the firm lowers the price of a monopoly good and raises the price of the tied good
All-or-Nothing Demands and the Exploitation Effect • An ordinary demand curve shows the marginal value of a given quantity. • An all-or-nothing demand curve shows the average value of a given quantity. • When a consumer pays the average value for a good, rather than the marginal value, then the consumer surplus is zero.