Download
1 / 20
200 likes | 287 Views
Explore methodologies to improve simulation of ozone and NOy in the upper troposphere and lower stratosphere using the CAMx model. Evaluate the impact of stratospheric air on background levels, with comparisons to satellite data and model performances.

E N D
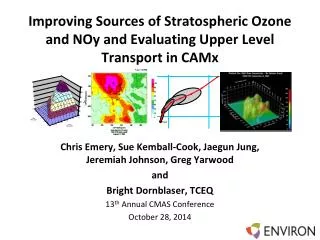
Improving Sources of Stratospheric Ozone and NOy and Evaluating Upper Level Transport in CAMx Chris Emery, Sue Kemball-Cook, Jaegun Jung, Jeremiah Johnson, Greg Yarwood and Bright Dornblaser, TCEQ 13thAnnual CMAS Conference October 28, 2014
Acknowledgements This project was funded by the Texas Commission on Environmental Quality The authors gratefully acknowledge the NOAA Air Resources Laboratory (ARL) for the provision of the HYSPLIT model and use of the READY website (http://www.ready.noaa.gov).
Background • As the NAAQS become more stringent, understanding transport is increasingly important • O3 and some NOy are long-lived in the upper troposphere (UT) and lower stratosphere (LS) • Can be transported for long distances • Can mix downward and influence surface O3 • Models used for O3 planning must accurately simulate O3and NOy in the UT/LS • Simulate impact of stratospheric air on background • Comparison with column-integrated satellite data
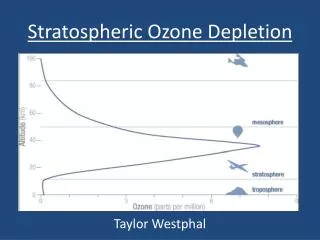
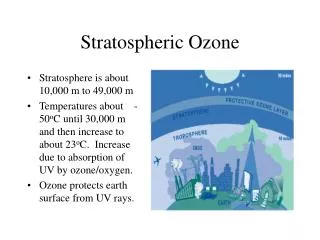
CAMx Vertical Grid • Model top 15 km • Downward motion brings LS air into modeling domain • Top BC is “Zero gradient” mixing ratio assumption TCEQ Vertical Grid Figure: http://esrl.noaa.gov/csd/assessments/ozone/2006/chapters/Q1.pdf
Modeling with the Standard CAMx Top BC • Comparison of OMI vs. CAMx NO2columns prompted deeper evaluation of CAMx in UT/LS • CAMx(red) underestimated UT/LS NO2 relative to INTEX-A aircraft profiles (black) • Ad hoc top BCs for O3 and NOy improved comparison (purple)
Layer Collapsing WRF CAMx • CAMx is typically run with fewer layers than WRF for efficiency • Effect on surface ozone generally minimal • Test effect on UT/LS O3 and NOy Layer Collapsing in UT No Layer Collapsing Surface
GEOS-Chem Global Model • A common source for lateral BCs • Spatially interpolate to CAMx grid • Map species to CAMx list • Add new top BCs
CAMx Model Performance Evaluation • 3 CAMx runs • Standard Zero Gradient Top BC, 28 layers • GEOS-ChemTop BC, 28 layers • GEOS-Chem Top BC, 38 layers (no layer collapsing) • Rider 8 modeling platform, June 2006 episode • Lightning NOxemissions • TCEQ AEM3 aircraft emission inventory • CB6r2 chemical mechanism
Good agreement < 6 km No clear benefit from top BC or extra layers GEOS-Chemmatches observed profile well Though not at all US sites Zero gradientrun Diffusive, poor > 6 km 38 layer top BCrun better than 28 layer top BC run > 6 km Ozonesonde at Huntsville, AL
NO2 Profile with new Top BCs • Top BC improves UT/LS NO2profile
Effect of Layer Collapsing • Layer collapsing affects NO2 profile less than ozone
Effect of Layer Collapsing on PAN Profile • CAMx has a low bias in middle and upper troposphere • PAN driven by BCs (GOES-Chem too low by >100 ppt)
HYSPLIT Trajectory Analysis • Forward/backward trajectories from UT/LS vertical intrusion events • Prepared using 4 sets of inputs: • WRF three-dimensional wind field • WRF two-dimensional wind field • HYSPLIT calculates vertical component using default divergence method • CAMxthree-dimensional wind field • Vertical component calculated using CAMx algorithm • EDAS three-dimensional wind field
Summary • New top BC improves performance in UT/LS • Allows for column-integrated satellite comparisons • UT/LS O3 for 38 layer run was better than 28 layer run • High vertical resolution needed for UT/LS transport • Effects at surface intermittent and generally small • 28 layers sufficient for surface O3 in Texas summertime • Larger effects expected in Intermountain West springtime • GEOS-Chemperformance in UT/LS was variable • Sometimes contributes to biases in CAMx • CAMx transport in UT/LS consistent with other models
GEOS-Chem PAN GEOS-Chem PAN (<100 ppt) lower than INTEX-A observations (300 ppt) near the tropopause
Effect of Layer Collapsing on HNO3 Profile • Good (slightly high) simulation of HNO3 profile