
-0.5%
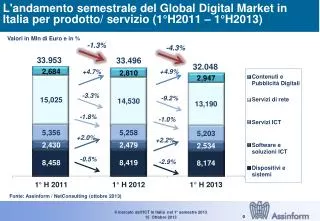
L'andamento semestrale del Global Digital Market in Italia per prodotto/ servizio (1°H2011 – 1°H2013). Valori in Mln di Euro e in %. -1.3%. -4.3%. 33.953. 33.496. 32.048. +4.9%. +4.7%. -3.3%. -9.2%. -1.8%. -1.0%. +2.0%. +2.2%. -0.5%. -2.9%.

-0.5%
E N D
Presentation Transcript
L'andamento semestrale del Global Digital Market in Italia per prodotto/ servizio (1°H2011 – 1°H2013) Valori in Mln di Euro e in % -1.3% -4.3% 33.953 33.496 32.048 +4.9% +4.7% -3.3% -9.2% -1.8% -1.0% +2.0% +2.2% -0.5% -2.9% Fonte: Assinform / NetConsulting (ottobre 2013)
I comparti IT e TLC si polarizzano sempre più su componenti innovative(1°H 2011 – 1°H 2013) Valori in Milioni di Euro e in % -1.3% -4.3% 33.953 33.496 32.048 +4.7% +4.9% +2.8% +4.5% -1.6% -7.2% -3.8% -3.5% (*) Non include quota a parte di VAS di rete fissa incorporata nel segmento Contenuti e Pubblicità Digitale Fonte: Assinform / NetConsulting (ottobre 2013)
L'andamento semestrale del mercato ICT (*) in Italia per prodotto/ servizio (1°H2011 – 1°H2013) (*) Non include i Servizi di Rete Valori in Mln di Euro e in % -0,5% -1.5% 16.156 16.244 15.911 -1.8% -1.0% +2.0% +2.2% -0.5% -2.9% Fonte: Assinform / NetConsulting (ottobre 2013)
Diffusione degli accessi a Banda Larga (Fibra ottica e xDSL – 1°H 2012 – 1°H 2013) Valori in migliaia di utenti attivi e in % +2.4% Tipologia di connessione (1°H 2012) Tipologia di connessione (1°H 2013) Fonte: Assinform / NetConsulting (ottobre 2013)
Previsioni sull’andamento del Global Digital Market (2010-2013E) Valori in Mln di Euro e in % -4.3% -1.8% 69.400 68.141 65.177 +7.2% +5.2% -5.5% -9.9% -2.4% -3.1% +2.4% +2.5% +0.01% -2.2% Fonte: Assinform / NetConsulting (ottobre 2013)
I comparti IT e TLC si polarizzano sempre più su componenti innovative(2011 –2013) Valori in Milioni di Euro e in % -1.8% -4.3% 69.400 68.141 65.177 +7.2% +5.2% +6.7% +5.2% -3.5% -7.9% -4.0% -3.7% (*) Non include quota a parte di VAS di rete fissa incorporata nel segmento Contenuti e Pubblicità Digitale Fonte: Assinform / NetConsulting (ottobre 2013)