Download
1 / 28
280 likes | 430 Views
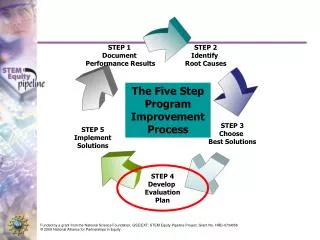
Reflections on the Cycle of the Five Step Program Improvement Process. STEP 1 Document Performance Results. STEP 2 Identify Root Causes. STEP 5 Implement Solutions. STEP 3 Choose Best Solutions. STEP 4 Develop an Evaluation Plan. The Five Step Process.

E N D
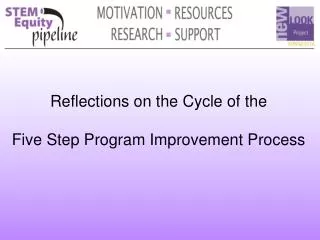
Reflections on the Cycle of the Five Step Program Improvement Process
STEP 1 Document Performance Results STEP 2 Identify Root Causes STEP 5 Implement Solutions STEP 3 Choose Best Solutions STEP 4 Develop an Evaluation Plan The Five Step Process
Summative (Outcome) Evaluation The ultimate impact of our efforts RESULTS
Short-term goals Increase in awareness Increase in knowledge Change in attitude Change in behavior Long-term goals Enrollment Achievement Completion Graduation Transition Select Outcome Measures
Long-term goals Start with long-term goals because . . . . . . impacting enrollment and completion takes time. . . . it builds the pipeline. . . . it supports partnering . . . it usually uses established measurement like performance indicators or institution-collected data.
Long-term Goals and Objectives • Increase the participation of females in PLTW • Increase the number of females in PLTW courses by 25% by 2012. • Increase the participation of females in Technology • Increase and sustain female enrollment in technology and pre-engineering classes to at least 15% at the community college
Long Term Measurement Tools Typically maintained by administration or institutional research office and reported to a funder, accrediting agency or system agency • Student level demographic data • Attendance records • Achievement records • Graduation records • Perkins core indicator data
Short-term goals Increase in awareness Increase in knowledge Change in attitude Change in behavior Long-term goals Enrollment Achievement Completion Graduation Transition Select Outcome Measures
Short-term Goals • Align and support achievement of long-term goals. • May be tied to a specific activity. • Generated through research on effective methods to reach long-term goal. • Measured through activity-specific tools. • Contain same elements as good long-term goals.
Short-term Objectives • Increase the participation of girls in First Robotics • 20% of the participants in the FIRST robotics teams at the five high schools will be girls as a result of the recruiting efforts implemented • Educate parents about engineering careers • 25% of the parents invited will attend the college reception for mothers and daughters who are in the top 10% in math and science at the high school
Short-term Measurement Tools • Invitation and attendance records • Pre-post attitude assessment • Pre-post knowledge assessment • Evaluation instrument • Post activity survey
Application of the Program Improvement Process An example from Assessing Women and Men in Engineering
One Week Residential Introduction to Engineering Summer Camp for High School Girls Goal: Recruit more girls to Penn State in engineering. Targeted girls who had the pre-requisites for engineering, but who weren’t considering engineering.
The camp that looked good…. 1-week residential engineering camp with an objective of recruiting high school girls • 42 high school girls participated • 41 were very enthusiastic about the experience • All senior participants responded that they planned to enter engineering in college in post-test • Compared to 40 of 42 saying they would NOT in pre-survey Source: Bogue, B and Shannahan B, ( 2010) Seven steps to get what we want. Presentation at Midwest Girls Collaborative Project Forum, Normal, Illinois, April 8, 2010.
But “failed”… Source: Bogue, B and Shannahan B, ( 2010) Seven steps to get what we want. Presentation at Midwest Girls Collaborative Project Forum, Normal, Illinois, April 8, 2010. • Tracking participants revealed that only 2 participants applied • As opposed to all of the seniors who said they would • Time analysis • Camp was expensive: about $1400 per girl • Cost analysis • Little time was spent on engineering activities: Only 27% !
STEP 1 Document Performance Results STEP 2 Identify Root Causes STEP 5 Implement Solutions STEP 3 Choose Best Solutions STEP 4 Develop an Evaluation Plan The Five Step Process
Setting, measuring and paying attention to the accomplishment of objectives changes outcomes! • Changed to day camp focusing on engineering • New Outcomes: • ½+ of participants now apply to engineering (compare to 2) • $142 per girl per day (compare to $1400) • 90% of the time is spent on engineering activities (compare to 27%) • Serves more 300 girls (compare to 50)
You’re in the Spotlight Long-Term Goals Short-Term Goals Did you meet them? If you were setting the short term goals now, would you change them in any way? • Did your project move you forward in meeting your long-term goal?
Assessment Resources • ICSPS New Look Showcase • STEM Equity Pipeline Webinars • May 21, 2008 Assessing Effectiveness: Do Your Program Activities Make a Difference? • June 16, 2008 Building Effective Program Assessments • Archived at www.stemequitypipeline.org • Assessing Women and Men in Engineering - www.aweonline.org
Conduct Activity • Utilize audience knowledge to prepare excellent marketing • Align pre-and post surveys to objectives • Record through pictures and video • Publicize event through local media
Final Steps • Analyze results • Compare to objectives • Adjust activity for next year based upon findings • Address new/related root causes • Disseminate • Send summary for posting • Send lots of pictures!
Extension Agent Report • Let us know how you use what you learn • Complete an extension agent report quarterly • Go to http://www.stemequitypipeline.org/StateTeams/ExtensionAgentReporting.aspx
Minnesota STEM Equity Pipeline and New Look Project Resources http://www.icsps.ilstu.edu/mn/NewLook/participant/index.html#SEPP
Questions? National Alliance for Partnerships in Equity STEM Equity Pipeline http://stemequitypipeline.org/ http://www.napequity.org/ Mimi Lufkin 610-593-8038 mimilufkin@napequity.org Illinois Center for Specialized Professional Support Minnesota New Look Project http://www.icsps.ilstu.edu/mn/newlook/index.html Lynn Reha 309-454-4944 x 203 lcreha@ilstu.edu Howard Glasser 517-648-0932 phone hglasser@napequity.org