Chapter2 Continuous-Wave Modulation
Chapter2 Continuous-Wave Modulation. Figure 2.1 Components of a continuous-wave modulation system: ( a ) transmitter, and ( b ) receiver.

Chapter2 Continuous-Wave Modulation
E N D
Presentation Transcript
Chapter2Continuous-Wave Modulation ©2000, John Wiley & Sons, Inc. Haykin/Communication Systems, 4th Ed
Figure 2.1Components of a continuous-wave modulation system: (a) transmitter, and (b) receiver. ©2000, John Wiley & Sons, Inc. Haykin/Communication Systems, 4th Ed
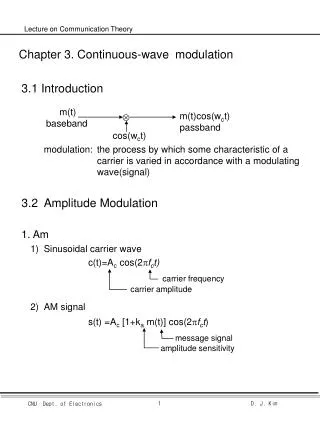
Figure 2.2Illustrating AM and FM signals produced by a single tone. (a) Carrier wave. (b) Sinusoidal modulating signal. (c) Amplitude-modulated signal. (d) Frequency-modulated signal. ©2000, John Wiley & Sons, Inc. Haykin/Communication Systems, 4th Ed
Figure 2.3Illustrating the amplitude modulation process. (a) Baseband signal m(t). (b) AM wave for | kam(t) | < 1 for all t. (c) AM wave for | kam(t) | > 1 for some t. ©2000, John Wiley & Sons, Inc. Haykin/Communication Systems, 4th Ed
Figure 2.4(a) Spectrum of baseband signal. (b) Spectrum of AM wave. ©2000, John Wiley & Sons, Inc. Haykin/Communication Systems, 4th Ed
Figure 2.5(a) Block diagram of product modulator. (b) Baseband signal. (c) DSB-SC modulated wave. ©2000, John Wiley & Sons, Inc. Haykin/Communication Systems, 4th Ed
Figure 2.6(a) Spectrum of baseband signal. (b) Spectrum of DSB-SC modulated wave. ©2000, John Wiley & Sons, Inc. Haykin/Communication Systems, 4th Ed
Figure 2.7Coherent detector for demodulating DSB-SC modulated wave. ©2000, John Wiley & Sons, Inc. Haykin/Communication Systems, 4th Ed
Figure 2.8Illustrating the spectrum of a product modulator output with a DSB-SC modulated wave as input. ©2000, John Wiley & Sons, Inc. Haykin/Communication Systems, 4th Ed
Figure 2.9Costas receiver. ©2000, John Wiley & Sons, Inc. Haykin/Communication Systems, 4th Ed
Figure 2.10Quadrature-carrier multiplexing system. (a) Transmitter. (b) Receiver. ©2000, John Wiley & Sons, Inc. Haykin/Communication Systems, 4th Ed
Figure 2.11(a) Spectrum of a message signal m(t) with an energy gap of width 2fa centered on the origin. (b) Spectrum of corresponding SSB signal containing the upper sideband. ©2000, John Wiley & Sons, Inc. Haykin/Communication Systems, 4th Ed
Figure 2.12Filtering scheme for the generation of VSB modulated wave. ©2000, John Wiley & Sons, Inc. Haykin/Communication Systems, 4th Ed
Figure 2.13Magnitude response of VSB filter; only the positive-frequency portion is shown. ©2000, John Wiley & Sons, Inc. Haykin/Communication Systems, 4th Ed
Figure 2.14Frequency response of a filter for producing the quadrature component of the VSB modulated wave. ©2000, John Wiley & Sons, Inc. Haykin/Communication Systems, 4th Ed
Figure 2.15(a) Idealized magnitude spectrum of a transmitted TV signal. (b) Magnitude response of VSB shaping filter in the receiver. ©2000, John Wiley & Sons, Inc. Haykin/Communication Systems, 4th Ed
Figure 2.16Block diagram of mixer. ©2000, John Wiley & Sons, Inc. Haykin/Communication Systems, 4th Ed
Figure 2.17(a) Spectrum of modulated signal s1(t) at the mixer input. (b) Spectrum of the corresponding signal s´(t) at the output of the product modulator in the mixer. ©2000, John Wiley & Sons, Inc. Haykin/Communication Systems, 4th Ed
Figure 2.18Block diagram of FDM system. ©2000, John Wiley & Sons, Inc. Haykin/Communication Systems, 4th Ed
Figure 2.19Illustrating the modulation steps in an FDM system. ©2000, John Wiley & Sons, Inc. Haykin/Communication Systems, 4th Ed
Figure 2.20Illustrating the relationship between frequency modulation and phase modulation. (a) Scheme for generating an FM wave by using a phase modulator. (b) Scheme for generating a PM wave by using a frequency modulator. ©2000, John Wiley & Sons, Inc. Haykin/Communication Systems, 4th Ed
Figure 2.21Block diagram of a method for generating a narrowband FM signal. ©2000, John Wiley & Sons, Inc. Haykin/Communication Systems, 4th Ed