Download
1 / 33
330 likes | 482 Views
10. Investment, Saving, and the Real Interest Rate. CHAPTER. EYE ONS. Bond Disposable income Stock Crowding-out-effect Saving Saving supply Investment demand Wealth Gross investment Bond market Net investment Financial market Financial capital Stock market

E N D
10 Investment, Saving, and the Real Interest Rate CHAPTER EYE ONS Bond Disposable income Stock Crowding-out-effect Saving Saving supply Investment demand Wealth Gross investment Bond market Net investment Financial market Financial capital Stock market Physical capital
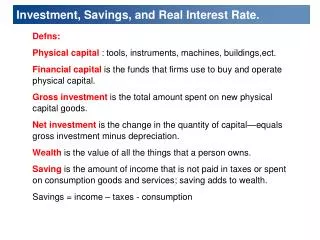
DEFINITION • Physical Capital Tools, instruments, machines, buildings, and other items produced in the past used to produce goods and services. • Financial Capital Funds firms use to buy and operate physical capital • Gross Investment Total amount spent on new capital goods • Net Investment Change in quantity of capital NI = GI - Depreciation
DEFINITION • Wealth Value of ALL the things that a person owns.. • Savings Amount of income NOT paid in taxes OR spent on consumption goods and services • Stock Market • Bond Market • Short-Term Securities Market • Loan Market MARKETS for FINANCIAL CAPITAL
PHYSICAL and FINANCIAL CAPITAL • Stock Market Stock certificate of ownership and claim to the profits that a firm makes. Stock market financial market where shares of companies’ stocks are traded. • Bond Market Bond promise to pay specified sums of money on specified dates; it is a debt for the issuer. Bond market financial market where bonds issued by firms and governments are traded • Firms often issue ST bonds as a way to get paid for sales before the buyer pays • Mortgage Backed Securities is a type of bond • Short-Term Securities Market Commercial and Treasury bills—promises by large firms and government to pay an agreed sum 90 days in the future.
PHYSICAL and FINANCIAL CAPITAL • Loan Market Banks and other financial institutions lower the cost of financing firms’ capital expenditures by accepting short-term deposits and making longer-term loans. • Households – Purchase big ticket items • Businesses – Short Term loans to • 1. Buy inventories, • 2. Extend credit to customers FINANCIAL INSTITUTIONS and MARKETS • Finance Markets • Financial Institution = Firm that operates on both sides of the market • Key Financial Institutions • Investment Banks • Commercial Banks • Government Sponsored mortgage lenders • Pension funds • Insurance Companies
GLOBAL FINANCIAL MARKET • Risk Loan may not be repaid Price of a stock or bond might fall Riskier the loan = higher is the interest rate. • Risk vs Rate Lenders want to earn the highest possible RIR Borrowers want to pay the lowest possible RIR Lenders and Borrowers will go anywhere in WORLD GLOBAL FINANCIAL MARKET Aggregate of ALL INDIVIDUAL Financial Markets Loanable Funds Market
INSOLVENCY and ILLIQUIDITY • Net Worth = Total Market Value – borrowed amount • Solvent Firm Firm with a positive net worth • Insolvent Firm Firm with a negative net worth • When assets are sold and debts are paid the owners (stockholders) pay the price • Illiquid Firm Has made long-term loans with borrowed funds AND Is faced with sudden demand to repay amount larger than cash on hand • Normally this firm would borrow from another institution but if all cash is drying up they go bankrupt.
INTEREST RATE and ASSET PRICES • Financial Assets Stocks, bonds, short-term securities, and loans • Interest Rate Percentage of the price of the asset Thus, Asset Price h = Interest Rate i and vice versa
LOANABLE FUNDS MARKET • LF USED FOR (DEMAND) • Business Investment • Government Budget Deficit • International Investment and Lending • Quantity of LF demanded Depends on: RIR and Expected Profit Firms: Compare RIR with expected profit on new capital investment decisions h RIR = iQty LF demanded • Changes in DLF (shifts) Happens when: Expected Profit Changes h Exp. Profit = h amt. invested = h DLF • Objective Influences: Business cycle, Technological change, Population growth • Subjective Influences (Keynes): “animal spirits” • Contagion Effects (Greenspan): “irrational exuberance” Investment decision Forward looking, based on subjective feelings Optimism = h Investment Pessimism = i Investment
LOANABLE FUNDS MARKET • LF COME FROM (SUPPLY) • Private Savings (largest part) • RIR • Disposable Income • Wealth • Expected Future income • Government Budget Surplus • International Borrowing • Quantity of LF supplied Depends on: Mostly Savings depends on RIR, Disp.Inc., Wealth, Exp.Fut.Inc. Firms: Compare RIR with expected profit on new capital investment decisions h RIR = h Savings = h Qty LF supplied • Changes in SLF (shifts) • Disposable Income h Disp. Inc. = h savings • Wealth h wealth = i savings • Expected Future Income hExp.Fut.Inc. = i savings • Default Risk h Default Risk = i savings
LOANABLE FUNDS MARKET • SHIFTS
LOANABLE FUNDS MARKET • Surplus, Shortage • Effects of Shifts
GOVERNMENT in the LOANABLE FUNDS MARKET • GDP Y = C+I+G+NX; (Expenditure) [NX is 0 globally] • GDP Y = C+S+NT; (Total Income) C+I+G+NX = C+S+NT I+G = S+NT I = S+NT-G Investment is financed by Private Savings and Govt. Savings Total Savings = Private Savings + Govt. Savings Govt. Surplus adds to private savings Govt. Deficit takes away from private savings decreases amount available for investment SLF = PSLF + GSLF h SLF iRIR iqty private funds & hqty investment and qty demand
Crowding-out-effect • Tendency for government budget deficit to raise the real interest rate and decrease investment • SURPLUS DEFICIT GOVERNMENT in the LOANABLE FUNDS MARKET
GOVERNMENT IN LOANABLE FUNDS MARKET • The Ricardo-Barro Effect • The proposition that a government budget deficit has no effect on the real interest rate or investment. • The Ricardo-Barro effect operates if private saving and the private supply of loanable funds increase to offset any government budget deficit so that the total supply of loanable funds is unchanged when the government has a budget deficit. • Most economists regard this outcome unlikely.
FORMULAS NI = GI - Depreciation • Asset Price h = Interest Rate i • DLF • RIR = i Qty LF demandedh • Exp. Profit = h amt. invested = h DLF • Optimism = h Investment & Pessimism = i Investment • SLF • RIR = h Savings = h Qty LF supplied • Disp. Inc. = h savings • wealth = i savings • Exp.Fut.Inc. = i savings SLF = PSLF + GSLF DLF = PDLF + GDLF
EYE on FINANCIAL CRISIS What Created the Global Financial Crisis? Events in the market for loanable funds, on both the supply side and demand side, created the global financial crisis. An increase in default risk decreased the supply of loanable funds. The disappearance of some major Wall Street institutions and lowered profit expectations decreased the demand for loanable funds. These institutions include Bear Stearns, Lehman Brothers, Fannie Mae and Freddie Mac, Merrill Lynch, and AIG.
EYE on FINANCIAL CRISIS What Created the Global Financial Crisis? But what caused the increase in default risk and the failure of so many financial institutions? Between 2002 and 2005, interest rates were low. There were plenty of willing borrowers and plenty of willing lenders. Fuelled by easy loans, home prices rose rapidly. Lenders bundled their loans into mortgage-backed securities and sold them to eager buyers around the world.
EYE on FINANCIAL CRISIS What Created the Global Financial Crisis? Then, in 2006, interest rates began to rise and home prices began to fall. People defaulted on mortgages and banks took losses. Some banks became insolvent. A downward spiral of lending was under way.
Did the Rescue Plan Crowd Out Investment? In mid-2007, on the eve of the onset of the global financial crisis, U.S. investment expenditure was $2.2 trillion. The government had a budget deficit of $0.2 trillion. So the quantity of loanable funds demanded and supplied was $2.4 trillion. The real interest rate was 3 percent a year. By mid-2009, U.S. investment expenditure had fallen to $1.5 trillion. The real interest rate had risen to 4.5 percent a year.
Did the Rescue Plan Crowd Out Investment? What caused the collapse of investment and the rise in the real interest rate? During 2008 and 2009, government rescue-plan outlays boosted the federal budget deficit by $1 trillion. In 2009, the budget deficit reached $1.2 trillion. To finance this deficit, the government issued bonds and the demand for loanable funds increased by $1 trillion.
Did the Rescue Plan Crowd Out Investment? In 2007, the real interest rate was 3 percent a year. The government budget deficit was $0.2 trillion. Private investment was $2.2 trillion.
Did the Rescue Plan Crowd Out Investment? The rescue-plan expenditures increased the demand for loanable funds. The real interest rate rose to 4.5 percent a year. The higher interest rate decreased private investment to $1.5 trillion. Without the rescue plan, depressed profit expectations might have reduced investment more.
Your Participation in the Loanable Funds Market • Think about the amount of saving that you do. • How much of your disposable income do you save? Is it a positive amount or a negative amount? • If you save a positive amount, what do you do with your savings? • Do you put them in a bank, in the stock market, in bonds, or just keep money at home? • What is the interest rate you earn on your savings?
Your Participation in the Loanable Funds Market • If you save a negative amount, just what does that mean? • It means that you have a deficit (like a government deficit). You’re spending more than your disposable income. • In this case, how do you finance your deficit? Do you get a student loan? Do you run up an outstanding credit card balance? • How much do you pay to finance your negative saving (your dissaving)? • How do you think your saving will change when you graduate and get a better-paying job?
Your Participation in the Loanable Funds Market • Also think about the amount of investment that you do. • You are investing in your human capital by being in school. What is this investment costing you? How are you financing this investment? • When you graduate, you will need to decide whether to invest in an apartment or a house or to rent your home. • How would you make a decision whether to buy or rent a home? • Would it be smart to borrow $300,000 to finance the purchase of a home? How would the interest rate influence your decision?
Investment and Capital: 1976-2006 Part (a) shows gross investment and depreciation. The gap between gross investment and depreciation is net investment. Part (b) shows net investment. Part (c) shows the capital stock.
Investment and Capital: 1976-2006 Gross investment increases in most years and increased rapidly during the booming 1990s, but it decreases in recession years—see part (a) of the figure. Recession years are highlighted in red.
Investment and Capital: 1976-2006 Depreciation increases in most years. Like gross investment, net investment increased rapidly during the 1990s expansion. Because net investment is always positive, the quantity of capital increases each year despite huge swings in net investment because the quantity of capital is large in comparison to net investment.
Interest Rate Puzzle The real interest rate paid by big corporations fell from 5.5 percent a year in 2001 to 2.5 percent a year in 2005. Alan Greenspan said he was puzzled that the real interest rate was falling when the U.S. government budget deficit was growing. Why did the real interest rate fall? The answer lies in the global loanable funds market.
Interest Rate Puzzle Global saving increased and the supply of loanable funds increased from SLF01 in 2001 to SLF05 in 2005. U.S. saving decreased and U.S. borrowing from the rest of the world increased stronglyduring these years. The Chinese, Japanese, and Germans all have much higher saving rates than do Americans.