Download
1 / 12
120 likes | 257 Views
This guide explains the normal distribution, a bell-shaped curve essential for understanding statistics. It covers key properties such as symmetry and the concentration of data around the mean. You'll learn about standard deviation, which measures variability, and the 68-95-99.7 rule that describes how data is distributed in normal distributions. Examples, including standardized IQ tests and SAT scores, are provided to illustrate practical applications. You'll become familiar with the relationship between probability and area, helping to visualize statistical concepts.

E N D
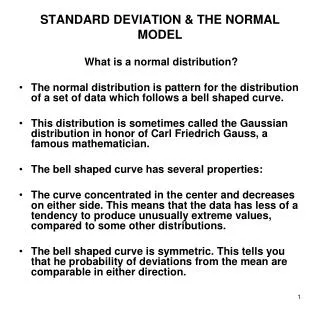
STANDARD DEVIATION & THE NORMAL MODEL What is a normal distribution? • The normal distribution is pattern for the distribution of a set of data which follows a bell shaped curve. • This distribution is sometimes called the Gaussian distribution in honor of Carl Friedrich Gauss, a famous mathematician. • The bell shaped curve has several properties: • The curve concentrated in the center and decreases on either side. This means that the data has less of a tendency to produce unusually extreme values, compared to some other distributions. • The bell shaped curve is symmetric. This tells you that he probability of deviations from the mean are comparable in either direction.
STANDARD DEVIATION & THE NORMAL MODEL • When you want to describe probability for a continuous variable, you do so by describing a certain area. • A large area implies a large probability and a small area implies a small probability. Some people don't like this, because it forces them to remember a bit of geometry (or in more complex situations, calculus). But the relationship between probability and area is also useful, because it provides a visual interpretation for probability. • Here's an example of a bell shaped curve. This represents a normal distribution with a mean of 50 and a standard deviation of 10.
Formula • Standardizing normal variables: • Formula:
68-95-99.7 Rule • 68% of the observations are within 1 standard deviation unit • 95% of the observations are within 2 standard deviation unit • 99.7% of the observations are within 3 standard deviation unit • http://davidmlane.com/hyperstat/normal_distribution.html
Example Some IQ tests are standardized to a Normal model with a mean of 100 and a standard deviation of 16. a) Describe the 68-95-99.7 rule for this problem b) About what percent of people should have IQ scores above 116? c) About what percent of people should have IQ scores between 68 and 84? d) About what percent of people should have IQ scores above 132? e) About what percent of people should have IQ scores above 120? f) About what percent of people should have IQ scores below 90? g) About what percent of people should have IQ scores between 95 and 130? h) A person is a genius if his/her IQ belong to the top 10% of the all IQ scores. What minimum IQ score qualifies you to be a genius?
Answers to the Example Some IQ tests are standardized to a Normal model with a mean of 100 and a standard deviation of 16. b) 16% c) 13.5% d) 2.5% e) About what percent of people should have IQ scores above 120? Z = (120 -100)/16 = 1.25 Find P(Z > 1.25) from standard normal chart or your TI calculator. Answer: 1-.8944 = .1056 f) About what percent of people should have IQ scores below 90? Z = (90 -100)/16 = -0.625 Find P(Z < -0.625) from standard normal chart or your TI calculator. Answer: .26 g) About what percent of people should have IQ scores between 95 and 130? Z = (95 -100)/16 = -0.3125 Z = (130 -100)/16 = 1.875 Find P(-0.3125< Z < 1.875) = .9699-.3783 = .5916 h) A person is a genius if his/her IQ belong to the top 10% of the all IQ scores. What minimum IQ score qualifies you to be a genius? The top 10% corresponds to the 90th percentile. For the standard normal the 90th percentile is 1.28. Hnece solve 1.28 = (Y-100)/16. The value of Y is 120.48.
Example • In 2006 combined verbal and math SAT scores followed a normal distribution with mean 1020 and standard deviation 240. • Suppose you know that Peter scored in the top 3% of SAT scores. What was Peter’s approximate SAT score? • Answer: 1471.2
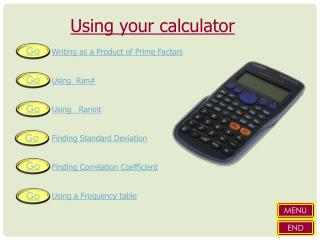
The TI-83 provides a function named normalcdf Press 2nd, DISTR (found above VARS) Scroll to normalcdf ( and press ENTER, or press 2. If z has a standard normal distribution: Percent(a < z < b) = normalcdf ( a , b ) Example: to find P( -1.2 < z < .8 ), press 2nd, DISTR, 2, then -1.2 , .8 ) Note that the comma between -1.2 and .8 must be entered Read .6731 To find Percent( z < a ), enter normalcdf ( -5 , a ) Example: normalcdf( -5 , 1.96) gives .9750 To find Percent( z > a ), enter normalcdf ( a , 5) Example: normalcdf( -1.645 , 5) gives .9500 Using the TI-83 to Find a Normal Percentage Always draw a picture! ? -1.2 .8 ? 1.96 ? -1.645
x1 x2 Using the TI-83/84 for Normal Percentages Without Computing z-Scores • We can let the TI find its own z-scores: • Find Percent(90 < x < 105) if x follows the normal model with mean 100 and standard deviation 15: • Percent(90 < x < 105) = normalcdf( 90 , 105 , 100 , 15) = .378 • Notice that this is a time-saver for this type of problem, but that you may still need to be able to compute z-scores for other types of problems!
x Suppose We’re Given a normal Percentage and Need A z-score? • IQ scores are distributed normally with a mean of 100 and a standard deviation of 15. What score do you need to capture the bottom 2%? • That is, we must find a so that Percent(x < a) = 2% when x has a normal distribution with a mean of 100 and a standard deviation of 15. • With the TI 83/84: a = invNorm( .02, 100 , 15) = 69.2