Download
1 / 34
350 likes | 545 Views
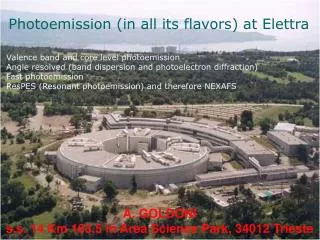
Photoemission (in all its flavors) at Elettra. Valence band and core level photoemission Angle resolved (band dispersion and photoelectron diffraction) Fast photoemission ResPES (Resonant photoemission) and therefore NEXAFS. GOLDONI s.s. 14 Km 163.5 in Area Science Park, 34012 Trieste.

E N D
Photoemission (in all its flavors) at Elettra Valence band and core level photoemission Angle resolved (band dispersion and photoelectron diffraction) Fast photoemission ResPES (Resonant photoemission) and therefore NEXAFS GOLDONI s.s. 14 Km 163.5 in Area Science Park, 34012 Trieste
22 beamlines in operation and open to external users • 1 beamline under commissioning • 2 beamlines under construction • 1 FEL test beamline
15 16 17 18 19 20 N 1s FWHM=0.7 eV Intensity N(Ek) 401 400 399 398 397 396 Ek (eV) Binding Energy (eV)
Low photon energy beamlines BaD ElPh 4.5-42 eV APE 16-90 eV VUV 20-200 eV T =500 - 9 K Typical ∆E < 10 meV Azimuthal scans
Are the electrons photoemitted with low photon energies the most bulk sensitive? Inelastic Mean Free Path ( Å) Electron Kinetic Energy (eV)
C60/Ag(111) 6 4 2 0 e- Attenuation length of low electron in solids: CoO/Ag and C60/Ag F. Offi et al., PHYSICAL REVIEW B 77, 201101(R),(2008)
Mott transition in V2O3 T=300K paramagnetic insulator T=200K paramagnetic metal F. Rodolakis et al., PRL 102, 066805 (2009)
Photoemission at Low photon energy Normal emission • metallic phase shows larger difference between surface and bulk • Surface is more • correlated than bulk • True also for other strongly correlated systems ?
Gap and dispersion in superconductors: MgB2 C. Cepek et al, in preparation Epitaxial growth of MgB2 layers on Mg(0001) Gap opening from > 5 ML
Low photon energy beamlines BaD ElPh 5-41 eV APE 16-90 eV VUV 20-200 eV T =500 - 20 K Typical ∆E < 20 meV Polar and Azimuthal scans
Photoemission at normal emission changing the photon energy: the K_ is scanned Three-dimensional Fermi-surface topology of the layered iron superconductor Ba(Fe1−xCox)2As2 P. Vilmercati et al., PHYSICAL REVIEW B 79, 220503(R),(2009)
Surface electron bands and Fermi surface of Be(0001) I. Vobornik et al, , PHYSICAL REVIEW B 72, 165424 (2005)
Surface electron bands and Fermi surface of Be(0001) Direct sensitivity to symmetry of the initial electron states obtained by polarization dependent photoemission. surface state is mainly of s-pz character, while the M surface state has an important mixture of the in-plane p states. These results confirm theoretical predictions. Drastic changes were measured in the Fermi surface as a function of photon polarization calling for a detailed theoretical evaluation of the photoemission matrix elements in the relevant experimental geometries. The measured Fermi surface cuts demonstrate how the Fermi surface mapping by ARPES with polarized light is directly related to the surface electronic structure. I. Vobornik et al, , PHYSICAL REVIEW B 72, 165424 (2005)
Low photon energy beamlines BaD ElPh 5-41 eV APE 16-70 eV VUV 20-200 eV T =700 - 100 K Typical ∆E < 20 meV Polar and Azimuthal scans
Probing Quasi-particle States Bound by Disparate Periodic Potentials P. Moras, et al, Phys. Rev. Lett. 97, 206802 (2006) 8 ML - Ag(111)/Ge(111), free of in-plane registry with the underlying substrate Ags-pquantum well states scatter coherently at the buried interface potential gaining a momentum equivalent to a reciprocal vector of the substrate lattice: unexpected set of new quasi-particle states
Fermi Surfaces P. Moras et al.,, Phys. Rev. Lett. 97, (2006))
19 Å Ag films on GaAs(110) exhibit a 1D quasi-periodic modulation, resulting in a Fibonacci sequence of parallel stripes with two different widths QW states of Ag/GaAs(110) behave in-between the one- and two-dimensional case: comparable to a lattice of coupled quantum wires or quasi one-dimensional chain systems
High photon energy beamlines SuperESCA 90-700 eV ALOISA 130-1000 eV BACH 150-1200 eV Materials Science
Catalyst dynamics during surface-bound carbon nanotube nucleation S. Hofmann et al., Nano Letters 7 (2007)) For SWNT we observe crystalline phase contrast from the transition metal catalyst nano-particles. The 0.20 nm reflection observed is expected for metallic fcc Ni(111), but also for Ni2O3(200) and Ni3C(113). We have highlighted some of the progress made towards an atomistic CNT growth model by combining in-situ TEM and XPS. Selective acetylene chemisorption and the formation of a carbon-rich surface layer were observed on otherwise crystalline transition metal nano-particles. Structural selectivity is determined by the dynamic interplay between carbon network formation and catalyst particle deformation. The catalyst is active in its metallic state; Fe and Ni films that were deliberately oxidised before annealing showed a lower/no nanotube yield on C2H2 exposure.
NO 2 286.0 285.5 285.0 284.5 284.0 283.5 Binding Energy (eV) 5.1 [d] [e] NO3 200 W) 5.0 150 NO 2 4.9 Photoemission Intensity Electrical resistance ( dose (L) 100 4.8 50 N 1s O 1s [f ] 4.7 0 538 536 534 532 530 528 408 404 400 0 1000 2000 3000 4000 Binding Energy (eV) Binding Energy (eV) Time (s) SWCNT Interaction with Gases A. Goldoni et al., JACS 125, 11329 (2003); J. Phys. Cond. Matter (2010) Spectra taken during the feedstock of NO2: 10 sec per spectrum NO
Graphene grown on Ni(111) A. Gruneis et al., New J. Phys.11 (2009) 073050
High photon energy beamlines SuperESCA 90-700 eV ALOISA 130-1000 eV BACH 150-1200 eV Materials Science
NEXAFS USED TO RECOGNIZE THE ORIENTATION OF ADSORBED MOLECULES Dimas G. de Oteyza et al., Adv. Funct. Mater. 19, (2009)
NEXAFS USED TO RECOGNIZE THE ORIENTATION OF ADSORBED MOLECULES
RESPES on Gd@C82: ionic character of Gd-C bonds and evidence of Gd3+ (4f binding energy >10 eV) S. Pagliara et al., PHYSICAL REVIEW B 70, 035420 (2004)
High photon energy beamlines SuperESCA 90-700 eV ALOISA 130-1000 eV BACH 150-1200 eV Materials Science
EVIDENCE FOR STRONG ITINERANT FLUCTUATIONS IN THE NORMAL STATE OF CeFeAsO0.89F0.11 IRON-OXYPNICTIDES F. Bondino et al, PRL 101 (2008) The splitting of the Fe 3s level can be taken as evidence of Fe-based spin-fluctuations. CeFeAsO0.89F0.11 exhibits features markedly different from that of Fe ionic compounds, but more akin to that of Fe metal. Fe 3s exhibits a two-peak structure with a splitting ΔE3s=2.9 eV seen in Figure 2(b), which would correspond to Sv=1 μB.
CONCLUSIONS At Elettra there are several beamlines for photoemission experiments. The beamlines can cover all the desired requirements for a photoemission experiments. You have just to choose the beamline more akin to your experimental conditions THANK YOU