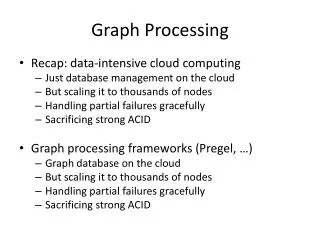
GRAPH PROCESSING
GRAPH PROCESSING. Why Graph Processing?. Graphs are everywhere!. Why Graph Processing?. Why Distributed Graph Processing?. They are getting bigger!. Road Scale. >24 million vertices >58 million edges *Route Planning in Road Networks - 2008. Social Scale. >1 billion vertices

GRAPH PROCESSING
E N D
Presentation Transcript
Why Graph Processing? Graphs are everywhere!
Why Distributed Graph Processing? They are getting bigger!
Road Scale >24 million vertices >58 million edges *Route Planning in Road Networks - 2008
Social Scale >1 billion vertices ~1 trillion edges *Facebook Engineering Blog ~41 million vertices >1.4 billion edges *Twitter Graph- 2010
Web Scale >50 billion vertices >1 trillion edges *NSA Big Graph Experiment- 2013
Brain Scale >100 billion vertices >100 trillion edges *NSA Big Graph Experiment- 2013
Lumsdaine, Andrew, et al. "Challenges in parallel graph processing." Parallel Processing Letters 17.01 -2007 Challenges in parallel graph processing
Challenges *Concept borrowed from Cristina Abad’s PhD defense slides
Build New Graph Frameworks! Key Requirements from Graph Processing Frameworks
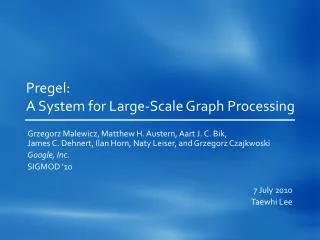
Malewicz, Grzegorz, et al. "Pregel: a system for large-scale graph processing.“ ACM SIGMOD -2010. Pregel
Life of a Vertex Program Iteration 0 Iteration 1 Computation Computation Placement Of Vertices Communication Communication Barrier Barrier Barrier Time *Concept borrowed from LFGraph Slides
Sample Graph B D A C E *Graph Borrowed from LFGraph Paper
Shortest Path Example B D A C E
Iteration 0 B 0 D ∞ Message (0+1) A ∞ C ∞ E ∞
Iteration 1 B 0 D ∞ Message (1+1) A 1 Message (1+1) C ∞ E ∞
Iteration 2 B 0 D 2 A 1 C ∞ E 2
Hoque, Imranul, and Indranil Gupta. "LFGraph: Simple and Fast Distributed Graph Analytics”. TRIOS-2013 Lfgraph – Yes, we can!
Features B D Cheap Vertex Placement: Hash Based A C E Low graph initialization time
Features B D Publish Subscribe fetch once information flow A C E Low communication overhead
Subscribe B D A C E Subscribing to vertex A
Publish B D A C E Publish List of Server 1: (Server2, A)
LFGraph Model B D A Value of A C E
Features B D Only stores in-neighbor vertices A C E Reduces memory footprint
In-neighbor storage B D Remote in-neighbor – read locally available value A Local in-neighbor – simply read the value C E
Iteration 0 B 0 D ∞ A ∞ C ∞ E ∞
Iteration 1 B 0 D ∞ Read value 0 A ∞ A 1 Value of A Read value ∞ C ∞ Value change in duplicate store E ∞
Iteration 2 B 0 D ∞ D 2 Local read of A A 1 Local read of A C ∞ E ∞ E 2
Features B D Single Pass Computation A C E Low computation overhead
Life of a Vertex Program Iteration 0 Iteration 1 Placement Of Vertices Computation Communication Computation Communication Barrier Barrier Barrier Time *Concept Borrowed from LFGraph Slides
Low, Yucheng, et al. "Graphlab: A new framework for parallel machine learning”. Conference on Uncertainty in Artificial Intelligence (UAI) - 2010 GraphLab
GraphLab Model B D D A A C E E
Gonzalez, Joseph E., et al. "Powergraph: Distributed graph-parallel computation on natural graphs." USENIX OSDI - 2012. PowerGraph
PowerGraph Model B D A1 A2 C E
Communication Analysis External on edge cuts Mirrors - in and out neighbors Ghost vertices - in and out neighbors External in neighbors
Computation Balance Analysis • Power Law graphs have substantial load imbalance. • Power law graphs have degree d with probability proportional to d-α. • Lower α means a denser graph with more high degree vertices.