Download
1 / 26
260 likes | 278 Views
Discover how the City of San Marcos and Texas State University are optimizing their bicycle infrastructure. Explore the analysis of current systems, proposed improvements, and the benefits for citizens. Learn about the methodology, data sources, and delivery of the project's plan.

E N D
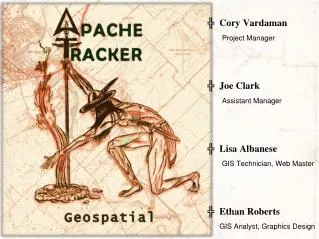
Members Cliff Walden- Manager Ty Wolosin- Assistant Manager John Karras- Web Master Ran Kataoka- GIS Analyst Rusty Rex- GIS Analyst
The optimization of the current City of San Marcos and Texas State University Bicycle System Prepared by: T.R.A.N.S.
Scope Location: San Marcos, TX Texas State University Population: 44,781 / 27,171 (2005) Median Age: 22.7 City Area: over 25 square miles Focus: City Master Plan Campus Master Plan
Introduction • Texas State University (TxState) has a student population of over 27,000 and growing and the City of San Marcos is seeing substantial growth • A survey completed for the City of San Marcos showed that new bike trails and lanes are the second highest priority for city development
Summary • The Texas State University master plan, widely promotes the development of an campus bike system • The City of San Marcos plans on developing the city into a bike friendly city with multiple bike lanes, routes and off road tracks
Examined the current bicycle infrastructure • and proposed new additions based on • impediments to a bicycle network • Bicycling for Transportation • Starting Points: Student Addresses and Census • Blocks • Destinations: High Flow Facilities, Central • TxState Campus • Problematic Areas • Traffic- Flow, traffic light wait time & • RR wait time • Terrain- distance & slope Purpose
Sources Texas Natural Resources Information System (TNRIS) US Census Bureau Capital Area Council of Governments (CAPCOG) San Marcos Police Department City of San Marcos Paul Hamilton and TxState Auxiliary Services Software All data was defined and analyzed using Environmental Systems Research Institution (ESRI) ARCGIS Desktop 9.1 and the Spatial Analyst extension. Deliverables utilized Microsoft Office Suite, Adobe Acrobat 5.0, Macromedia Studio 8, and Roxio Easy Media Creator 8.
Literature Review • CURRENT TRANSPORTATION PROBLEMS • HOW THE PROBLEM OF TRANSPORTATION AFFECTS SAN MARCOS • ALTERNATIVES • SAN MARCOS AND A BIKE PATH NETWORK: A GOOD FIT • IT CAN WORK: USING DAVIS, CALIFORNIA AS AN EXAMPLE • HOW WOULD SAN MARCOS CITIZENS BENEFIT?
Methodology • Data was spatially defined using the North American Datum • of 1983 and the projected coordinate system: • NAD_1983_Stateplane_Texas_Central_FIPS_4203_Feet • The first objective was to prioritize the areas of greatest need • Divided analysis into two segments of population groups - Non-resident Students - Residents determined by census block demographics • Identified constraints that needed to be overcome • Identified areas that can be used in their current state and areas that needed expansion or improvements • TRANS examined the current infrastructure and integrated our findings into a final plan for recommendation
FLOW CHARTSecondary Data- cost surface DEM Convert to Slope Traffic Light Wait Time Raster Railroad crossing raster Traffic Flow Raster Slope Normalize Normalize Normalize Normalize Weight 32% Weight 10% Weight 6% Weight 23% Normalized Weighted Slope Normalized Weighted Lights Normalized Weighted Railroad Normalized Weighted Flow Corridor Cost Surface
Cost Road Cost Surface Raster Calculator Destinations Cost Surface with roads Cost Weighted Cost Distance Starting Points Cost Direction Shortest Path Shortest Path FLOW CHARTSecondary Data- shortest path
Results • A majority of our least cost routes did not follow major roads • Aquarena Springs Dr and Ranch Road 12 were identified as the highest ‘cost’ (safety, difficulty, time) roads. • These avoided roads are primate candidates for bike lanes. • Bike lanes have been proposed on several of the roads that we found to be high cost. • Several proposed bike lanes were identified as low cost roads under the current infrastructure and should be lower priority.
Post Rd N. LBJ RR 12 Aquarena Springs Sessoms Hopkins IH 35
Final Deliverables • Detailed final report • Professional poster for display • Website containing: • Online presentation • Updated online access to documents • Links to related online resources • CD containing: • All data • Metadata • Report • PowerPoint presentation • CD instructions
Discussion • Limitations to San Marcos Bike Network. - Distance, Slope, non-landscape impediments • Five major areas of student locations outside of TxState campus: Post Rd., Aquarena Springs, North LBJ, RR12, and Wonder World • Cost of new bike lanes and/or routes: $7,758,308 based on 45 miles of new bike lanes • Extensive research uncovered no previous studies on bicycle analysis that would have provided a blueprint for guidance
Conclusion • Both the City of San Marcos and TxState have implemented bike networks into their master plans • TxState campus master plan, calls for limiting car transportation through campus • This data can be used for determining the safest and most efficient routes for bike trails in San Marcos and the TxState campus. The results can be used to study transportation needs and obstacles of San Marcos. This will allow sound decisions to be made for future growth and expansion of both San Marcos and TxState. • Bicycle analysis is very objective and open to individual interpretation