Download
1 / 17
170 likes | 189 Views
This data highlights disparities in academic performance, graduation rates, and food insecurity among different ethnicities in California's K-12 and higher education systems.

E N D
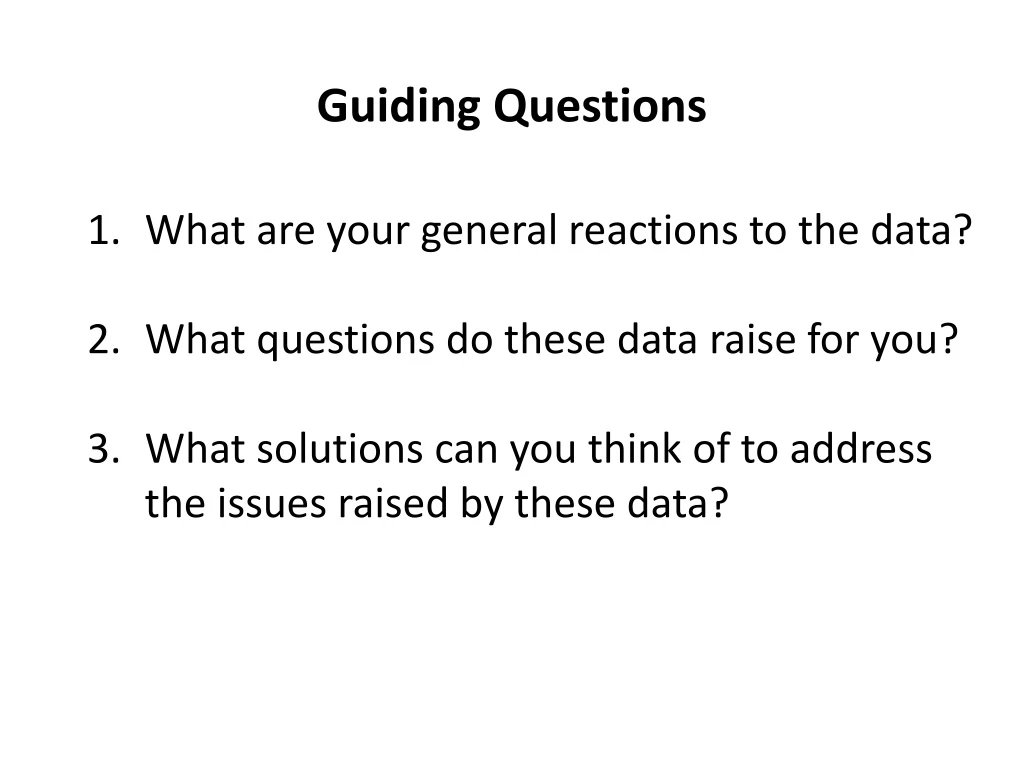
Guiding Questions What are your general reactions to the data? What questions do these data raise for you? What solutions can you think of to address the issues raised by these data?
Smarter Balanced Grade 3 English Language Arts/Literacy Performance, by Ethnicity (2016-17) Source: California Department of Education, 2017 (accessed Oct. 2017).
Smarter Balanced Grade 8Math Performance, by Ethnicity (2016-17) Source: California Department of Education, 2017 (accessed Dec. 2017).
Smarter Balanced Grade 11 Math Performance, by Ethnicity (2016-17) 11th graders who score in the Standard Exceeded range are considered ready for college-level math upon entering a CSU or California community college and may directly enroll in a for-credit math course without taking a placement exam or first enrolling in a developmental math course. Source: California Department of Education, 2017 (accessed Oct. 2017). In 11th grade, Standard Met = “conditionally college ready”; Standard Exceeded = “college ready.” Students not meeting the “college ready” benchmark by the time they enroll at CSU are required to take remedial coursework.
Cohort Graduation Rates, by Ethnicity (2015-16) Source: California Department of Education, 2017 (accessed Oct. 2017).
12th Grade A-G Completion, by Ethnicity and Gender (2015-16) Source: California Department of Education, 2017 (accessed Oct. 2017).
Suspension, by Ethnicity (2016-17) Source: California Department of Education, 2017 (accessed Oct. 2017).
Admissions Rate, Cal State Universityand University of California Systems, by Ethnicity (Fall 2016) Source: CSU Analytic Studies, 2017; UC Office of the President, 2017 (accessed Dec. 2017). Rates reflect the freshman cohort of California residents entering college in Fall 2016. UC system includes Pacific Islander students in the Asian group and does not report data for Two or More Races.
First-Year Retention Rates, California State University and University of California Systems, by Ethnicity (Fall 2016) Source: CSU Analytic Studies, 2017; UC Office of the President, 2017 (accessed Jan. 2018). Rates reflect the percentage of the class which began as first-time freshmen in Fall 2015 that returned in Fall 2016. The remainder either dropped out or transferred to other institutions. UC system includes Pacific Islander students in the Asian group and does not report data for Two or More Races.
42 percent of students in the University of California system and 21 percent of students in the California State University system are food insecure. Source: Martinez et al, Student Food Access and Security Study, July. 2017; California State University, Serving Displaced and Food Insecure Students in the CSU, Jan. 2016. According to the USDA, the definition of “food insecure” ranges from “reduced quality, variety or desirability of diet, with little or no indication of reduced food intake” to “experiencing reduced food intake at times due to limited resources.”
Six-Year Postsecondary Completion Rates, by Ethnicity (2016) Sources: University of California Infocenter, 2017; California State University Analytic Studies, 2017; California Community College Chancellor’s Office (CCCCO) Scorecard, 2017 (all accessed Jan. 2018). Six-year graduation rates are for freshmen entering UC/CSU in 2010 and graduating with a Bachelor’s degree in 2016. Six-year degree, certificate, or transfer students are for students entering CCC in 2010. For CCC, the “Asian” category excludes Filipino and Pacific Islander students.
Bachelor’s Degree Attainment Age 25 and Older, by Ethnicity and Gender (2016) Source: U.S. Census Bureau, American Community Survey, 2016 (accessed Jan. 2018). Based on 5-year estimates.
Bright Spot The high school program originated at Hayward Unified, which is also piloting it at a middle school. 72 percent of Puente high school graduates complete A-G requirements compared to 45 percent of students statewide. The Puente Project supports high school and community college students toward college graduation by providing professional development for teachers and counselors and building relationships between them and students. Source: The Puente Project, 2017.
Turning the curve… When San Diego State University found that low-income students were more likely to graduate if they lived on campus, it created financial incentives for them to do so. With this and other initiatives, the graduation rate for Latino students jumped from 31 percent in 2002 to 60 percent in 2013. Source: The Education Trust, Using Data to Improve Student Outcomes, May 2016.
…Add additional slides with any other data of interest, using the Commonly Used Data Sources document for ideas!