Download
1 / 101
1.01k likes | 1.23k Views
EU Population Ageing and its effect on the sustainability and adequacy of pension, health and Long-Term Care systems Marcello Morciano Health Economics Group, University of East Anglia (UK)

E N D
EU Population Ageing and its effect on the sustainability and adequacy of pension, health and Long-Term Care systems Marcello Morciano Health Economics Group, University of East Anglia (UK) Institute for Economic and Social Research, University of Essex (UK)CAPP – Research Centre for the Analysis of Public Policies, University of Modena and Reggio Emilia (IT) Paris, 13 September 2017
INDEX: A two-part lecture • Part I • The socio-demographic transition process in the EU countries... • Impact of Population Ageing on the Economy • Part II • Impact of Population Ageing on the sustainability and adequacy of: • Pension, • Health and • Long-Term Care systems
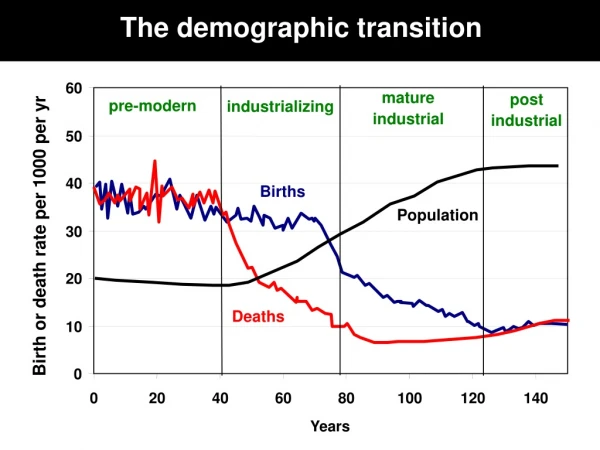
The demographic transition E-mail: m.morciano@uea.ac.uk
DEMOGRAPHIC PRESSURE: the EU ageing challenge • The European society is ageing faster: • As a consequence, the EU would move from having four people of working-age to each person aged over 65 years to about two people of working-age • More older people will stress the pension, the health care system and the economy. • More will require assistance in everyday activities (Long-Term Care, LTC), and an increasingly number will spend time in nursing homes. • Who will pay for this and how? • How this will re-shape our societies? Percentage of population above 80 years in the EU region Percentage of population above 65 years in the EU region 1% 1960 today 2060 5% 12% 10% 18% 30%
Member states with the largest populations in 2013 and 2060 Source: Table 4, the ageing of EU p. 15
Total Fertility Rates, 1950 to 2050 in selected EU countries Source: UN population projection
The progressive “individualisation” of European societies Share of single-person households in 2011 (% of all households) In cities, the emerging “4-2-1” family structure (4 grandparents to look after; 2 parents (caregivers), neither of whom has siblings; and 1 child) is emblematic of the demographic transition process many older people live alone Source: Eurostat (Census hub HC419)
Old-age dependency ratios in selected EU countries 1970-2060
DEMOGRAPHIC PRESSURE: Old-age dependency ratio • important differences between and within EU countries • important differences within a given country (e.g. urban/rural area; rich/poor areas) Source: ESPON
Projection of net migration flows, 2010 and 2020 to 2060 • important differences between (and within)EU countries • Internal migration from poor to rich EU area Table 1 (AAE-the ageing report) p. 11
The population pyramids in selected EU countries Age structure of Germany’s population The dotted line indicates the excess male or female population in certain age groups. The data are in thousands or millions. Source: United Nations, Department of Economic and Social Affairs, Population Division (2015). World Population Prospects: The 2015 Revision. <https://esa.un.org/unpd/wpp/Graphs/DemographicProfiles/>
The population pyramids in selected EU countries Age structure of Italy’s population The dotted line indicates the excess male or female population in certain age groups. The data are in thousands or millions. Source: United Nations, Department of Economic and Social Affairs, Population Division (2015). World Population Prospects: The 2015 Revision. <https://esa.un.org/unpd/wpp/Graphs/DemographicProfiles/>
The population pyramids in China Age structure of China’s population The dotted line indicates the excess male or female population in certain age groups. The data are in thousands or millions. Source: United Nations, Department of Economic and Social Affairs, Population Division (2015). World Population Prospects: The 2015 Revision. <https://esa.un.org/unpd/wpp/Graphs/DemographicProfiles/>
The Epidemiological pressure Although the size of the older population influences the economy, the health status is the major drivers of the need for (public/private) support and related costs • EU citizens aged 65 could expect less than half of their remaining years to be free from conditions affecting their ability to manage daily living activities but… • ageing of the big generations of baby-boomers increases the number of those potentially in needs • Trends in disability in EU are not always clear 51%43% of remaining life in good health Source: Own elaborations from Table 1 (p.11) in Social Protection Committee-European Commission (2014). Year 2009.
Who provide informal support? Factor influencing the supply of care Relatives and friends provide the first and more relevant form of support. Informal (unpaid) care is important in all EU countries, but is more common in some than in others Average amount of informal care vs. percentage of informal carers Formal and informal care can be substitutes or complements, depending on the type of care and needs Notes: informal care provided to someone outside the household in the population aged 50 and older. Source: SHARE data elaboratedby Rodrigues, R., Huber, M. & Lamura, G. (eds.) (2012). Facts and Figures on Healthy Ageing and Long-term Care. European Centre for Social Welfare Policy and Research: Vienna.
Who provide informal support? Factor influencing the supply of care Relatives and friends provide the first and more relevant form of support. Informal (unpaid) care is important in all EU countries, but is more common in some than in others Potential Support Ratio in Italy [(𝐴𝑔𝑒 25−69)/(𝐴𝑔𝑒 70+)] Source: UN, Department of Economic and Social Affairs, Population Division (2015). World Population Prospects: The 2015 Revision
Who provide support at old-age? The role of migrant workers The future sustainability of a model based on the provision of informal LTC support faces the question: will future cohort of people in needs of LTC be as likely to have a spouse or children that provide care for them? Main countries of origin and destination of migrant care workers in Europe Share of foreign-born workers in community services vs. those privately employed by households in selected EU countries Source: Rodrigues, R., Huber, M. & Lamura, G. (eds.) (2012). Facts and Figures on Healthy Ageing and Long-term Care. European Centre for Social Welfare Policy and Research: Vienna.
The socio-economic gradient with health Birth-cohort trends in older-age functional disability and their relationship with socio-economic status in the United Kingdom Source: Morciano M., Hancock R. and Pudney S., (2016) ‘Birth-cohort trends in older-age functional disability and their relationship with socio-economic status: Evidence from a pooling of repeated cross-sectional population-based studies for the UK’. Social Science & Medicine.
At-risk-of-poverty by age groups (compared to the total population) Source: EU-SILC 2009 data elaboratedby Rodrigues, R., Huber, M. & Lamura, G. (eds.) (2012). Facts and Figures on Healthy Ageing and Long-term Care. European Centre for Social Welfare Policy and Research: Vienna.
Material deprivation rate and at-risk-of-poverty rate of 65+ pop Source: EU-SILC 2009 data elaboratedby Rodrigues, R., Huber, M. & Lamura, G. (eds.) (2012). Facts and Figures on Healthy Ageing and Long-term Care. European Centre for Social Welfare Policy and Research: Vienna.
Impact of Population Aging on the Economy E-mail: m.morciano@uea.ac.uk
Ageing will negatively affect economic growth • Population ageing is widely expected to have detrimental effects on aggregate economic growth • This potential arises from the fact that fundamental economic behaviours, such as labour supply and consumption, vary systematically over the lifecycle • People tend to consume less than they earn during the middle part of the lifecycle when they are at peak labour supply, but more than they earn during the older part of the lifecycle when they reduce labour supply and finance health-related consumption • IMF estimates indicate that ageing can reduce the EU aggregate annual growth rate by as much as: • 0.6pp during the period 2014-2019 • 0.9pp during the period 2020-2025 • From the 1990-2005 average annual growth rate of 2.1% source: UN
Working-Age population growth will fall dramatically • On average across the EU, working-age population growth will fall from 1.7% over 2000-2015 to -5.5% over 2015-2030 • All EU countries will face either a slower-growing or declining working-age population, and corresponding pressure on labour supply Growth in Working-Age population across the EU (%) E-mail: m.morciano@uea.ac.uk source: UN
Ageing Will Also Reduce the Economy’s Savings Rate • In addition to reducing labour supply, population aging will reduce the economy’ savings rate, and in turn, investment • The academic literature using the life-cycle model estimates declines in the average savings rate of 0.5-1.2 pp from a one pp rise in the old age dependency ratio Old Age Dependency Ratio and Household Savings Rate (OECD countries) source: UN, OECD
Many factors can mitigate the impact of ageing on the Economy …but fiscal challenges will remain A number of developments can dampen the impact of ageing on the economy: • Policy reforms that improve labour force participation rates • Raised retirement age • Investment in ‘silver’ industries • Immigration flows • Financial inflows, which could fill a domestic savings-investment gap • Innovation and technological progress in the long run • Human capital development and increased productivity However, the fiscal challenges are large and will require re-thinking of social programs, most of which were designed for a growing-population model Further, the historical experience is one of under-estimation of the pace of population ageing: populations have aged more rapidly than forecasted
Thank you for your attention E-mail: m.morciano@uea.ac.uk
Impact of Population Ageing on Public Finances E-mail: m.morciano@uea.ac.uk
The estimated impact of population ageing on Public Finances in EU
Pension and Healthcare Expenditures are already high 9 out of the 28 EU countries already spend more than one-fifth of their GDP on pension and healthcare pension spending is about twice spending on healthcare
Key indicators for fiscal sustainability challenges 28 ip037_vol1
The demographic transition is occurring in the context of the global financial crisis and recession, which led to dramatic increase in debt levels for a number of countriesThe average EU debt-to-GDP ratio rose from 43.4% in 2007 to 73.6% in 2014 The Financial Crisis led to a large increase in EU debt levels, further pressuring fiscal sustainability
The Financial Crisis led to a large increase in EU debt levels, further pressuring fiscal sustainability • Private and public sector debt is high in EU countries • Public debt challenges seem to be the greatest in Southern European countries • Public debt challenges are lowest in the Baltics and Nordics (except Finland and Iceland) • Private debt challenges are highest in LU and CY • In Western European countries the risks related to public debt financing and affordability appear to be rather muted (only Ireland faces affordability challenges).
Impact of Population Aging on the Pension systems E-mail: m.morciano@uea.ac.uk
A taxonomy of EU pension systems • Detailed comparison of pension systems across EU countries is a difficult task and beyond this lesson • Pension systems were already covered in previous lessons • and more details will come in future lessons too • Just a remind: all the countries of the EU have set up schemes whereby workers are assured of a certain level of income upon their retirement
A taxonomy of EU pension systems • Schemes are: i) public; ii) mandatory; iii) PAYGO financed • However the degree of development of single national schemes is very different, as it is different the mechanism of determination of pension benefits and social security contributions, the degree of complementarity between public and private sector, the interaction between pension systems and other tier of the social protection system • It is possible to resort to a very broad distinction between two different type of pension system which finds an explanation into the hystorical evolution of pension systems in Europe. • the Beveridgeansystem • the Bismarkiansystem
The Beveridgean system • social security benefits ensure for each citizen (resident) a basicincome • (public) pension benefits are flat (and normally means tested). • individuals who want (and can) supplement this basic income during old age, turn to the market and join private pension schemes (either voluntarily or as part of their labour contract) • typical countries: Denmark, Ireland, the Netherlands and the United Kingdom
The Bismarkian system • people have a right to social security benefits during old age only insofar as they acquire that right by working when adult • the pension benefits are earnings-related and profession-related, generally subject to maximum limits. • often supplemented with a minimum pension guarantee for people who have had only weak attachment to the labour force • limited role to voluntary pension arrangements • typical countries Germany, Belgium, Sweden, France and the southern European countries
A taxonomy of EU pension systems • In the economic literature (see for example Conde Ruiz and Profeta 2007) it emerges that Beveridgean countries w.r.t Bismarkian countries are associated with: • Lower public pensionspending • High-incomeinequality • More intense presence of privatelyfinancedpensionschemes • Higher replacement rates for low income individuals
A broader/comprehensive classification of pension systems • A broader and more comprehensiveclassificationis the World Bank/OECD taxonomy. • Pensionsystems can be classifiedinto a threelevelscheme, whereeachlevelpursues a differentobjective • First pillar: avoidingpoverty in oldage. Typically public and PAYGO, universal or flat rate benefit or minimum pension, contains strong redistributive elments • Second pillar: ensuringadequacy, occupationalschemes, can be public or private, DB or (N)DC, funded or PAYGO, mayvary in the degree of redistribution, typicallybased on the labour market position of the insured • Third pillar: givingflexibility, individualplans, typicallyvoluntary, private and funded • Remember that this an over-simplified classification; each country experiences pension schemes with different level of interaction across pillars
The effect of ageing on the pension system • What is the expected effect on pension systems of the demographic transition? • Fertilitydecrease • Longevityincrease • Reduction in the economicgrowth • Reduction in the rate of return of capital • Increasing political weight of the old part of the population • Pension policy reformsshouldfindsolutionsthatredistributeoptimallyrisksamongindividuals and generations • Broadly speaking two fundamentals different approaches to reform pension systems: • Radical reforms: change the financingmethod • Parametricreforms: change the computationalrule and/or retirementage
The effect of ageing on the pension system • What is the expected effect on pension systems of the demographic transition? • Fertility decrease • Longevity increase • Reduction in the economic growth • Reduction in the rate of return of capital • Increasing political weight of the old part of the population 2014 Pension Sustainability Index for western Europe and North America
The reforming process of EU pension systems • Whatkind of policies can be implemented in order to face the expectedageing of the Europeanpopulation and the slowdown in economicgrowth? • Modify pension portfolio • Increasecontributions • Decreasepension benefits • Increaseretirementage • Each policy has associated risks & difficulties to be implemented • Financial risks in an era of low interest rates; inter-generational distribution of burden • Taxwedge and distortions • Political costs and inter-generational distribution of the economic burden • An older workforce, with implications on labour and total productivity
The reforming process of EU pension systems • WhathaveEuropeangovernmentdone on theirpensionsystem in order to face theseproblems? • There are some common trends: • Substantiallyincreasedretirementage • Reducedvalorization of pastearnings in the pension formula • Modifiedindexationmechanism of pension benefits • Introduceddifferentkind of automaticadjustment (NDC, linkingretage to lifetimeexpectations; sustainabilityadjustments) • Successful policies? Probably too early to give a definitive answer. Ex-ante evaluation possible through dynamic simulation
Impact of pension reforms on the average effective retirement age from the labour force Average exit age from the labour force expected in 2060, men
Impact of pension reforms on the average effective retirement age from the labour force Average exit age from the labour force expected in 2060, women
Changes in the replacement ratio in selected EU countries across for the period 2010-2060
Summarising… • Sustainability: reforms enacted in EU countries seem to be able to realize the aim of maintain (or recover) financial sustainability in the long run. • Adequacy: in many countries, Replacement Ratio (RR) would remain similar to those of todays new pensioners. In others, will reduce considerably • This is realised mainly through a substantial increase in the average retirement age/ reduction RR and less by developing a more thight complementary private pension pillar • The open issues are: • the ability of an ageed workforce to deliver reasonable rate of growth in the future • risk of poverty among the poorest segment of the population