Download
1 / 34
340 likes | 459 Views
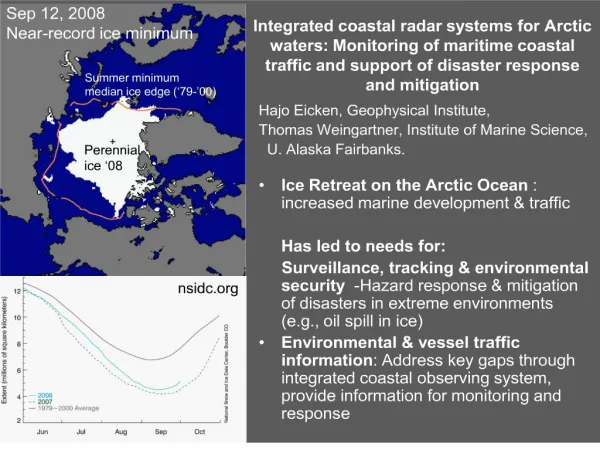
Monitoring activities of running waters in Sweden. Leonard Sandin Swedish University of Agricultural Sciences Uppsala, Sweden. Outline. Sampling methods macroinvertebrates Taxonomic resolution Classification system Reference site selection/criteria Monitoring program

E N D
Monitoring activities of running waters in Sweden Leonard Sandin Swedish University of Agricultural Sciences Uppsala, Sweden
Outline • Sampling methods macroinvertebrates • Taxonomic resolution • Classification system • Reference site selection/criteria • Monitoring program • Supporting information
Macroinvertebrate samplingmethod • Standardized kick-sampling • SSEN 27828 • 1 m * 1 min and 5 samples • Preferably hard-bottom • 0,5 mm mesh • Autumn sampling • Sorting 2 h then subsampling (in the national surveys)
Taxonomic resolution • Predetermined taxa list (~500) • Expert group decided on the list • Based on: • Relatively easy to determine • Gives “extra” ecological information • Part of indices/metrics
Ecological quality criteria • New system will be adopted from 2007 (in revision at the moment) • Includes three metrics/indices: • ASPT Ecological quality • DJ index Eutrophication • MISA index Acidification/Acidity • Should be sampled at least once in the autumn each year
TypesEcoregions 20 Borealic uplands
Ecoregions 22 Fennoscandian shield
Ecoregions 14 Central plains
ASPT & DJ index • ASPT: • Armitage et al. 1983 • Family level index • Scoring system (1-10) for each family • Divided by no of scoring families • DJ index • Dahl & Johnson 2005 • Multimetric index for eutrophication • Five different parts: • No of EPT taxa, relative abundance of Crustacea, rel. abund. EPT taxa, ASPT, and Saprobix index (Zelinka & Marvan 1961) • Each index scores 1-3 • Sum from 5 (lowest/worst) to 15 (highest/best quality)
DJ index The DJ index has to be re-scaled by: Taking (reference value – 5) / (index value -5)
MISA index • Johnson & Goedkoop 2005 • Multimetric index • Includes six parts/indices: • No of families, no of taxa of Gastropoda, no of taxa of Ephemeroptera, the ratio of the relative abundance of Ephemeroptera and Plecoptera, the AWIC index [Dawy-Bowker et al 2005 relative abundance of shredders • Each index is normalised to be between 0-10 • Rescaling: MISA = 10 x sum indexnorm / 6 • Final score between 0-100
Reference values • Ecoregion 14 • ASPT: 5.37 • DJ index: 10 • MISA: 47.5 • Ecoregion 22 • ASPT: 6.53 • DJ index: 14 • MISA: 47.5 • Ecoregion 20 • ASPT: 6.67 • DJ index: 14 • MISA: 47.5
Final ecological quality One-out-all-out among the three indices/metrics
Calculating the indices • www.aqem.de • ASTERICS software
National monitoring program • Three levels: • National surveys • Trend stations • ?????????
National surveys • Lake inventories since 1972 • Biology – first time 1995 • Repeated 2000 • Benthic macroinvertebrates • 700 streams and 700 lakes • 2005 only lake chemistry again
Sampling strategy • Streams stratified by catchment area • 350 with areas 15-50 km2 • 350 with areas 50-250km2 • Randomly selected point • Sampling 100-600 m upstream
Changing sampling sites? • 606 sites included in analysis • 1995: county of Västernorrland removed • Site suitability assessed based on substratum • Blocks > 200 mm or Sand and silt < 2 mm • Samples could be moved further upstream
Weather • Autumn 2000 among the wettest during the 20th century • Yearly precipitation at most 160 – 170 % of normal • Air temperature 1.6 to 2.1 °C above normal • Water temperature 3 °C above normal in streams • 1995: precipitation and temperature near normal Runoff (l/km2, s) From Wilander et al. 2003
Weather • Main problem in south-west 2000 1995 2000 • Rölanda å • County of • Västra Götaland
Trend stations • 69 streams • Across Sweden • Water chemistry (all) • Metals (30 stations) • Macroinvertebrates and phytobenthos (48 stations) • Electrofishing (28 stations – all with bf sampling) • Macroinvertebrates and metals (16 stations)
Trend stations • 40 sites with catchment area < 300 km2 • 6 further sites catchment area < 1000 km2 • 1 site with catchment area 1260 km2 • 1 site with catchment area 19825 km2 (Ljusnan) • Reasons: • Existing long time series • NATURA 2000 sites • Trout, Pearl mussels, Salmon, European crayfish • Large amount of existing catchment info available • Used for earlier international reporting
Liming references • 19 streams • Water chemistry • Metals • Phytobenthos • Benthic macroinvertebrates • Fish
Physical parameters • Standardised field protocol: • Sampling site information • In stream vegetation • Substratum • Riparian zone 0-5 meter perpendicular to the stream • Near stream zone 0-30 meter perpendicular to the stream
Sampling site information • Site name • Width (sampling site) and length (Sampling site) • Stream width • Water level (normal/low/high) • Water depth (mean for site and maximum) • Velocity (0 = 0 m/s, 1 < 0.2 m/s, 2 0.2-0.7 m/s, 3 > 0.7 m/s) • Turbidity (clear, turbid, very turbid) • Water colour (clear, coloured, very coloured) • Water temperature
Substratum/ in stream vegetation • Classification 0 = absent, 1 < 5% cover, 2 5-50 % cover, 3 > 50% cover • Substratum: 11 classes from fine sediment (< 0.06 mm) to rock (> 2000 mm) • In stream vegetation: 6 vegetation types • Above water vegetation, long shoot vegetation, floating leaved, rosette vegetation, mosses, benthic algae • Organic material • Fine detritus, coarse detritus, fine dead wood, coarse dead wood
Riparian zone • Same cover classes • Trees • Bushes • Grasses • Other vegetation types (specify) • Others (stone, agricultural land, without vegetation etc) • Shadow (cover as above)
Near stream zone • Same cover classes • 13 land-use classes (e.g.): • Deciduous forest • Coniferous forest • Wetlands • Agricultural land • Grassland • Heath • Artificial land
Water chemistry parameters • pH, alkalinity • Conductivity • Ca, Mg, Na, K • SO4, Cl, F, Si • NH4-N, NO2+NO3, Total N, Total P • Absorbance • TOC