Download
1 / 41
410 likes | 713 Views
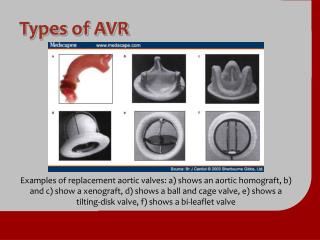
Types of AVR. Examples of replacement aortic valves: a) shows an aortic homograft, b) and c) show a xenograft, d) shows a ball and cage valve, e) shows a tilting-disk valve, f) shows a bi-leaflet valve. Elderly Patients. Pts >80years, operative mortality as high as 30%.

E N D
Types of AVR Examples of replacement aortic valves: a) shows an aortic homograft, b) and c) show a xenograft, d) shows a ball and cage valve, e) shows a tilting-disk valve, f) shows a bi-leaflet valve
Elderly Patients • Pts >80years, operative mortality as high as 30%. • Percutaneous aortic balloon valvuloplasty is an alternative to valve replacement introduced in ‘80s. • Inflating one or more large balloons across the aortic valve from a percutaneous route, a modest decrease in gradient and improvement in symptoms
Balloon Valvuloplasty • Follow-up has demonstrated a high rate of re-stenosis (>60% at 6 months and nearly 100% at 2 years), with no decrease in mortality rate after procedure • Therefore, now only has a role in critically ill elderly pts who are not candidates for surgery or as a “bridge” in critically ill pts before AV replacement
Helping to Solve a Grave Problem Onset Severe Symptoms • Aortic stenosis is life threatening and progresses rapidly • Survival after onset of symptoms is 50% at 2 years and 20% at 5 years1 • “Surgical intervention [for severe AS] should be performed promptly once even…minor symptoms occur”1 100 80 Angina Latent Period (Increasing Obstruction, Myocardial Overload) Syncope Failure 60 Survival, % 40 0 2 4 6 Average Survival, y 20 0 40 50 60 70 80 Age, y
Addressing a Serious Unmet Need No AVR Aortic Valve Replacement (AVR) 54 60 61 74 69 100 43 52 80 60 57 Patients, % 40 48 46 40 39 31 20 26 0 Jan Bach Freed Bouma Pellikka Charlson Varadarajan 1999 2005 2006 2009 2009 2010 2006 • At least 40% of patients with severe aortic stenosis (AS) do not have an AVR2-8
Edwards SAPIEN Transcatheter Heart Valve With the RetroFlex 3 Transfemoral System • For inoperable patients with severe symptomatic native aortic valve stenosis
Patient-Focused Multidisciplinary Heart Team Approach • Multidisciplinary in all aspects: • Patient selection • Procedure planning • Patient treatment • Post-operative care
The PARTNER Trial Protocol Severe Symptomatic Native Aortic Valve Stenosis Yes No Assessment Operability 2 Cohorts Individually Powered (N = 1,057) Cohort A (n = 699) Cohort B (n = 358) Cohort A Yes Assessment Transfemoral Access No Yes Assessment Transfemoral Access No TF (n = 492) TA (n = 207) Not in Study 1:1 Randomization 1:1 Randomization 1:1 Randomization TF TAVR (n = 244) AVR (Control) (n = 248) TA TAVR (n = 104) AVR (Control) (n = 103) TF TAVR (n = 179) Standard Therapy (Control) (n = 179) vs vs vs Primary Endpoint: All-Cause Mortality OverLength of Trial (Superiority) Co-Primary Endpoint: Composite of All-Cause Mortality and Repeat Hospitalization (Superiority) Primary Endpoint: All-Cause Mortality (1 yr)(Non-inferiority) TA, transapical; TF, transfemoral.
A Seminal Date in Cardiovascular Medicine September 22, 2010 on NEJM.org
Absolute Reduction in Mortality Continues to Diverge at 2 Years Edwards SAPIEN THV Standard Therapy • HR [95% CI] = 0.57 [0.44, 0.75] • P (log rank) < .0001 100 • ∆ at 1 yr = 20.0%NNT = 5.0 pts 67.6% 80 50.7% All-Cause Mortality, % 60 43.3% 40 30.7% • ∆ at 2 yr = 24.3%NNT = 4.1 pts 20 0 Months
Edwards SAPIEN THV Delivered QOL Benefits 100 Standard Therapy 80 • Improvement in quality of life 60 KCCQ Score (Mean) 40 20 ∆ = 13.9P < .001 ∆ = 24.5P < .001 0 0 2 4 6 8 10 12 Months Edwards SAPIEN THV MCID = 5 points MCID, minimum clinically important difference.
Peri-procedural Hazards • At 30 days, TAVR resulted in more frequent strokes, major vascular complications, and bleeding events than standard therapy • All strokes, 7.3% vs 1.7%, P = .02 • Major vascular complications, 16.8% vs 1.1%, P < .0001 • Bleeding events, 16.2% vs 2.2%, P < .0001
Sobering Perspective 5-Year Survival 35 30 30 28 25 23 20 Survival, % 15 12 10 5 4 3 0 Breast Lung Cancer Colorectal Prostate Ovarian Severe * Cancer Cancer Cancer Cancer Inoperable * * * * † AS * National Institutes of Health. National Cancer Institute. Surveillance Epidemiology and End Results. Cancer Stat Fact Sheets.http://seer.cancer.gov/statfacts/. Accessed November 16, 2010. † Using constant hazard ratio. Data on file, Edwards Lifesciences LLC. Analysis courtesy of Murat Tuczu.
Two-Year Outcomes of Transcatheter Aortic Valve Replacement (TAVR) in “Inoperable” Patients With Severe Aortic Stenosis: The PARTNER Trial Raj R. Makkar, MDOn behalf of The PARTNER Trial Investigators • TCT 2011 | San Francisco, CA | November 10, 2011
Background (1) • Transcatheter aortic valve replacement (TAVR) is the recommended treatment for “inoperable” patients with severe aortic stenosis (AS), based upon 1-year results of The PARTNER Trial which demonstrated reduced mortality and improved quality of life. • However, whether clinical benefit and valve performance are sustained beyond one year is unknown and longer term outcomes will importantly alter clinical practice decisions.
Objectives • To evaluate the clinical outcomes of TAVR compared to standard therapy at 2 years in “inoperable” aortic stenosis patients. • To assess valve hemodynamics and durability using echocardiography. • To perform subgroup analyses to better define the impact of co-morbidities on outcomes.
Inclusion Criteria • Severe calcific aortic stenosis defined as echo derived valve area of < 0.8 cm2 (EOA index < 0.5 cm2), and mean gradient > 40 mmHg or jet velocity > 4.0 m/s. • NYHA functional class II or greater. • Risk of death or serious irreversible morbidity of AVR as assessed by cardiologist and two surgeons must exceed 50%. • Surgeons must agree and attest that before PARTNER these patients would not have received AVR treatment!
Key End-Points for 2 Year Analysis • All cause mortality • Cardiac mortality • Rehospitalization • Stroke • NYHA functional class • Days alive and out of hospital • Echo-derived valve areas, transvalvular gradients, paravalvular aortic regurgitation • Mortality outcomes stratified by STS score
Study Flow - Inoperable Cohort n = 358 Randomized Inoperable n = 179 Standard therapy n = 179 TAVR 85/85 patients 100% followed at 1 Yr 124/124 patients 100% followed at 1 Yr 56/56 patients 100% followed at 2 Yr 99/102 patients* 97.1% followed at 2 Yr • 5 withdrawals in the first year in Standard Rx arm • *3 patients followed outside of protocol window in TAVR group • No patients were lost to follow-up
Standard Rx TAVR All Cause Mortality (ITT)Crossover Patients Followed • HR [95% CI] =0.57 [0.44, 0.75] • p (log rank) < 0.0001 67.6% • ∆ at 1 yr = 20.0%NNT = 5.0 pts 50.7% All Cause Mortality (%) 43.3% 30.7% • ∆ at 2 yr = 24.3%NNT = 4.1 pts Months
Standard Rx TAVR All Cause Mortality (ITT)Landmark Analysis Mortality 0-1 yr Mortality 1-2yr • HR [95% CI] =0.58 [0.37, 0.92] • p (log rank) = 0.0194 • HR [95% CI] =0.57 [0.44, 0.75] • p (log rank) < 0.0001 50.7% All Cause Mortality (%) 35.1% 30.7% 18.2% Months
Standard Rx TAVR Cardiovascular Mortality (ITT)Crossover Patients Censored • HR [95% CI] =0.44 [0.32, 0.60] • p (log rank) < 0.0001 • ∆ at 1 yr = 24.1%NNT = 4.1 pts 62.4% 44.6% Cardiovascular Mortality (%) 31.0% 20.5% • ∆ at 2 yr = 31.4%NNT = 3.2 pts Months
Standard Rx TAVR Repeat Hospitalization (ITT) • HR [95% CI] =0.41 [0.30, 0.58] • p (log rank) < 0.0001 72.5% • ∆ at 1 yr = 26.9%NNT = 3.7 pts 53.9% Repeat Hospitalization (%) 35.0% 27.0% • ∆ at 2 yr = 37.5%NNT = 2.7 pts Months
NYHA Class Over TimeSurvivors • p = 0.61 • p < 0.0001 • p < 0.0001 16.9% 23.7% 57.5% 60.8% 93.9% 92.2% Percent Baseline 1 Year 2 Year Treatment Visit
TAVR All Stroke (ITT) Standard Rx • HR [95% CI] =2.79 [1.25, 6.22] • p (log rank) = 0.009 Incidence (%) • ∆ at 1 yr = 5.7% • ∆ at 2 yr = 8.3% 11.2% 5.5% 13.8% Months 5.5%
All Cerebrovascular Events (%) Events Note: Percents are of patients in the trial (n/179).
TAVR Mortality or Stroke (ITT) • HR [95% CI] =0.64 [0.49, 0.84] • p (log rank) = 0.0009 Standard Rx • ∆ at 1 yr = 16.1%NNT = 6.2 pts 68.0% 51.3% All Cause Mortality or Stroke (%) 46.1% 35.2% • ∆ at 2 yr = 21.9%NNT = 4.6 pts Months
EOA Mean Gradient Mean Gradient & Valve Area Mean Gradient (mm Hg) AVA (cm²) N = 84 N = 89 N = 158 N = 162 N = 137 N = 143 N = 65 N = 65 N = 9 N = 9 • Error bars = ± 1 Std Dev
Moderate or Severe None to Mild Mortality Stratified by Paravalvular Leak (ITT)Starting at Discharge • p (log rank) = 0.891 Death Incidence (%) 35.3% 41.2% 40.5% 27.2% Months
STS <5 STS 5-14.9 STS ≥15 Mortality Stratified by STS Score (ITT) TAVR Standard Rx • p value (log rank) = 0.676 • p value (log rank) = 0.012 Death Incidence (%) Months Months Numbers at Risk
Conclusions (1) At 2 years, in patients with symptomatic severe ASwho are not suitable candidates for surgery… • TAVR remained superior to standard therapy with incremental benefit from 1 to 2 years, markedly reducing the rates of… • All cause mortality • Cardiovascular mortality • Repeat hospitalization • TAVR improved NYHA functional status and decreased Class III/IV symptoms compared to standard therapy (17% vs 64%; p < 0.001).
Conclusions (2) At 2 years, in patients with symptomatic severe AS who are not suitable candidates for surgery… • There were more neurologic events in TAVR patients vs Standard Rx (16.2% vs 5.5%; p = 0.003) with 5 new events (3 strokes and 2 TIAs) between 1-2 years in TAVR patients. • After 30 days, differences in stroke frequency were largely due to increased hemorrhagic strokes in TAVR patients. • A subgroup analysis according to surgical risk score suggests that the most pronounced benefit of TAVR is in patients without extreme clinical co-morbidities.
Conclusions (3) At 2 years, in patients with symptomatic severe AS who are not suitable candidates for surgery… • TAVR hemodynamics by echo showed durable improvements in AVA and mean gradients up to 3 years after implantation. • Moderate or severe paravalvular AR in the TAVR patients did not influence 2-year survival and there was a trend towards reduced paravalvular AR between 1 and 2 years.
Clinical Implications • Two year data continues to support the role of TAVR as the standard-of-care for symptomatic patients with aortic stenosis who are not surgical candidates. • The ultimate value of TAVR in “inoperable” patients will depend on careful selection of patients who are not surgical candidates, and yet do not have extreme co-morbidities that overwhelm the benefits of TAVR and render the intervention futile.