Matrix Operations: Total Sales Comparison & Car Rental Simulation
Learn how to add and multiply matrices to analyze data, solve problems, and simulate car movements between cities for strategic analysis. Compare theoretical predictions with experimental observations.


Matrix Operations: Total Sales Comparison & Car Rental Simulation
E N D
Presentation Transcript
Matrix Operations Lesson 6.2
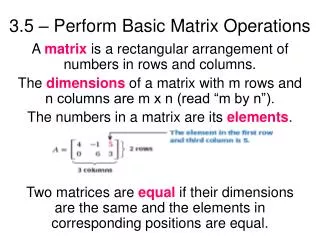
We have seen that a matrix is a compact way of organizing data, similar to a table. • Unlike tables, matrices can be added and multiplied to help you solve problems. • Consider this problem from Lesson 6.1. • Matrix [A] represents sports drinks, fruit juices, and waters sold this week from the vending machines at the main entrance and the back entrance of the school. • Matrix [B] contains the same information for last week. What are the total sales, by category and location, for both weeks
What are the total sales, by category and location, for both weeks? • To solve this problem, you add matrices [A] and [B].
Example A • This matrix represents a triangle. • Graph the triangle and its image after a translation left 3 units. Write a matrix equation to represent the transformation.
Example A • This matrix represents a triangle. • Describe the transformation represented by this matrix expression. This matrix addition represents a translation left 4 units and down 3 units.
Example A • This matrix represents a triangle. • Describe the transformation represented by this matrix expression. scalar multiplication
Example B • The school cafeteria offers a choice of ice cream or frozen yogurt for dessert once a week. During the first week of school, 220 students choose ice cream and 20 choose frozen yogurt. During each of the following weeks, 10% of the frozen-yogurt eaters switch to ice cream and 5% of the ice-cream eaters switch to frozen yogurt. • How many students will choose each dessert in the second week?
The initial matrix, represents the original numbers of ice-cream eaters and frozen-yogurt eaters. • In the transition matrix , • the top row represents the transitions in the number of ice-cream eaters, and • the bottom row represents the transitions in the number of frozen-yogurt eaters.
Think about how you calculate the numbers for the second week. • The second week’s number of ice-cream eaters will be 220(0.95)+20(0.10), or 211 students, • In effect, you multiply the two entries in row 1 of [A] by the two entries in column 1 of [B] and add the products. The result, 211, is entry c11 in the answer matrix, [C].
Similarly, the second week’s number of frozen-yogurt eaters will be 220(0.05)+20(0.90), or 29 students • The number of frozen-yogurt eaters in the second week is the sum of the products of the entries in row 1 of [A] and column 2 of [B]. The answer, 29, is entry c12 in the answer matrix, [C].
To find the third week, we repeat the procedure with a new initial matrix.
Find Your Place • In this investigation you will simulate the weekly movement of rental cars between cities and analyze the results. • Each person represents a rental car starting at City A, City B, or City C. • Follow the Procedure Note to simulate the movement of cars. At the beginning of the simulation and after each move, a class recorder should make note of the number of cars at each city.
Procedural Note • All students should position themselves in one of three designated locations in the room, City A, City B, or City C. Report the starting number of cars at each city to the recorder. • Use your calculator to generate a random number, x, between 0 and 1. • Determine your location for next week as follows:
Procedural Note • On the teacher’s signal, you move (or stay) as indicated. • Count the number of cars at each city and report this value to the recorder. • Repeat the simulation five times. Each time, record the number of cars at each city.
Work with your group to make a transition diagram and a transition matrix that represent the rules of the simulation.
Write an initial condition matrix for the starting quantities at each city. Then, show how to multiply the initial condition matrix and the transition matrix for the first transition. How do these theoretical results for week 1 compare with the experimental data from your simulation?
Use your calculator to find the theoretical number of cars at each city for the next four weeks. Find the theoretical long-run values of the number of cars at each city.
Compare these results with the experimental values in your table. If they are not similar, explain why.
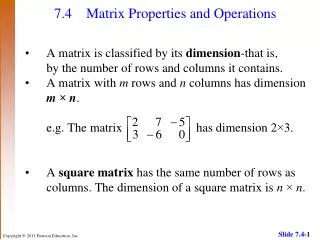
Example C • Consider this product. • Determine the dimensions of this product. You can multiply a 2x2 matrix by a 2x3 matrix because the inside dimensions are the same—the 2 row entries match up with the 2 column entries. The outside dimensions tell you the dimensions of the product.
Example C • Consider this product. The product has dimensions 2x3.
Example C • Consider this product. • Describe how to calculate entries in the product.