Download
1 / 26
260 likes | 405 Views
Use of ArcGIS Schematics for Water Resource Modeling. Ahmad A. Tavakoly , Ph.D. Candidate, UT Civil Engineering Acknowledgments: David R Maidment, Zong -Liang Yang, Tim Whiteaker , Lisa H. Meyer and Cedric H. David. November 14, 2013. 1. Outline. Motivation: studying pollution in rivers

E N D
Use of ArcGIS Schematics for Water Resource Modeling Ahmad A. Tavakoly, Ph.D. Candidate, UT Civil Engineering Acknowledgments: David R Maidment, Zong-Liang Yang, Tim Whiteaker, Lisa H. Meyer and Cedric H. David November 14, 2013 1
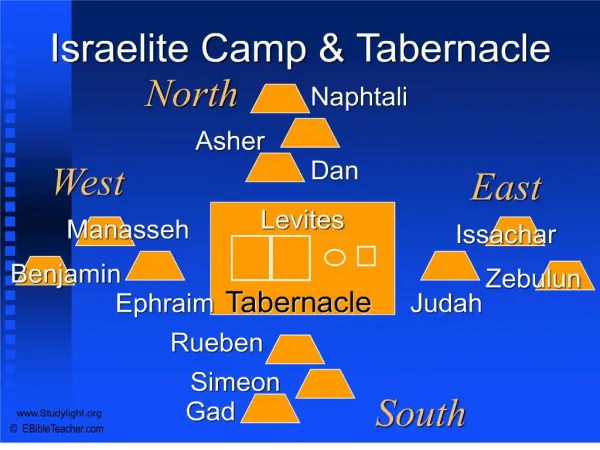
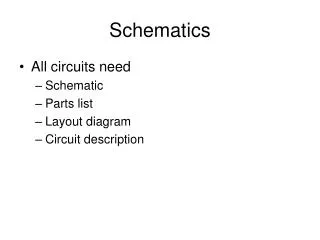
Outline • Motivation: studying pollution in rivers • Introduction to Schematic Networking and Processor tools for studying: • Linear network analysis • Route flow and solute transport through networks • Visualization for decision support • Example study: San Antonio-Guadalupe River Basin 2
Understanding pollution by nutrients • Organisms require carbon (C), nitrogen (N), phosphorus (P) for critical cellular processes • During the past century, human activities have been rapidly changing. Most importantly this has led to increases in energy and food production, use of fertilizer and animal manure, atmospheric deposition of nutrients, and wastewater flows • Non-point source (NPS) pollution from agricultural land is the leading cause of water quality deficiencies in the United States (USEPA, 2007) 3
Objectives We use a current study of the Texas gulf coast region to answer the following questions: • How total nitrogen is spatially distributed throughout San Antonio and Guadalupe river basins? • How can we integrate a nitrogen database with the river routing model? • How can we use a GIS Schematic Processor for flow and transport modeling in large scale river network? 4
Two models of nitrogen transfer N Nitrogen moves from land to river Collection Flow Nitrogen transfers through rivers 5
GIS-based steady-state modeling framework Texas Anthropogenic Nitrogen Budget Schematic network RAPID River routing model Reservoirs Waste water treatment plants Observation Calibration Total nitrogen load estimation ArcGISOnline Share as service in CRWR-arcgis01 6
Next step … Apply the lumped annual nitrogen load for nitrogen modeling Add nitrogen modeling to river modeling 7
River routing model, RAPID The Noah-MP data are used by a river model called RAPID to forecast stream flows. RAPID uses a matrix-based version of the Muskingum method to compute the flow and volume of water in river networks and is applied to the NHDPlusdataset. The real time water decision support system is developed in the University of Illinois at Urbana-Champaign 8
Texas Anthropogenic Nitrogen budget Sources and inputs of nitrogen within Texas were quantified based on datasets of fertilizer inputs, crop cultivation areas, livestock populations, and atmospheric deposition. Nitrogen sources in Texas have been quantified at the county level [Meyer, 2012 ] and is based on two years of data (2008-2009) due to limited data availability. 9
Data Acquisition and Processing The vector-based river network and reservoir data from the enhanced version of the National Hydrography Dataset (NHDPlus) http://www.horizon-systems.com/nhdplus/ Point source from EPA: Discharge Monitoring Report (DMR) Pollutant Loading Tool http://cfpub.epa.gov/dmr/ Monitored water quality N data: Texas Commission on Environmental Quality and Marine Science Institute UT http://www.tceq.texas.gov/waterquality/clean-rivers/data/samplequery.html 11
Schematic network • A product created by the Arc Hydro Toolset • Represents connectivity between features in the • landscape through a network of nodes and links • The schematic network is composed of two feature classes: SchemaLink and SchemaNode • SchemaNodes are located at the centroid of the features that they represent • SchemaLinks are straight lines that connect SchemaNodes 12
Schematic network 3) stream links 2) stream nodes 1) watersheds and streams 4) watershed centroids 5) watershed to stream 13
Schematic processor Cx= C0e- λt Equations to simulate hydrologic processes Schematic network model The schematic network represents the hydrologic features as a network of links and nodes. SchemaNodes show hydrologic features, such as catchments or stream junctions. SchemaLinks describe the connections between nodes. 14 Whiteaker et al., 2006 21
Schematic processor What if we could move things through the network based on the NHDPlus river network … Node NitrogenInput Link NitrogenInput Direction of Flow Decay …simulating processes along the way 15 21
Mapped blue lines NHDPlus dataset provides a coherent description of topography and hydrographic features for the Unites States. Gauges located directly on NHDPlus. 16 21
Mapped blue lines for San Antonio and Guadalupe basins 5,195 river reaches NHD flowlines and catchments 17 21
Schematic network for San Antonio and Guadalupe Basins 18 21
Schematic network 19 21
First order decay rate Cx= C0e- λt Average Pure Water Velocity Time = 0 x = x0 Time > 0 x > x0 20 21
First order decay rate Cx= C0e- λt Cx= nitrogen load (kg/yr) , C0= initial load (kg/yr), λ= decay rate (s-1) t= residence time (s) How to calculate the residence time? t= l/v l: river length; v: velocity 21 21
Load reduction on lakes and reservoirs Nrem=R x Nin Nin is an estimate of N input to lake and reservoir surface waters R is an estimate of the fraction of N retained within lakes and reservoirs Vf= is the apparent settling velocity for N (m year-1) by lake or reservoir sediments; Hl is the hydraulic load (m year-1) for a given lake, reservoir Q is water input to lakes and reservoirs (km3 year-1) and A (km2) is surface area of individual lakes. Average Vf: 8.91 (m/yr) Ref.: Alexander et al. (2002) Harrison et al., (2009) 23 3
Results 24
How would you use schematics to study relationships between libraries & data?? Image from connectedlibrarians.com 25
Thank you for your attention!! Question?? Ahmad A. Tavakoly Ph.D. CandidateThe University of Texas at AustinEnvironmental and Water Resources Engineering URL: https://sites.google.com/a/utexas.edu/atavakoly/ 26