Download
1 / 19
190 likes | 611 Views
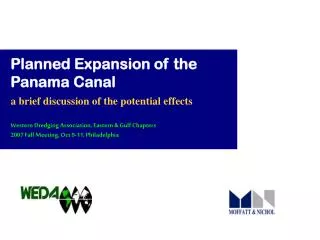
The Panama Canal Expansion and its Impacts on Global Shipping Patterns. Jean-Paul Rodrigue Associate Professor, Dept. of Global Studies & Geography, Hofstra University, New York, USA Van Horne Researcher in Transportation and Logistics, University of Calgary, Canada.

E N D
The Panama Canal Expansion and its Impacts on Global Shipping Patterns Jean-Paul Rodrigue Associate Professor, Dept. of Global Studies & Geography, Hofstra University, New York, USA Van Horne Researcher in Transportation and Logistics, University of Calgary, Canada
Factors Impacting North American Freight Distribution in View of the Panama Canal Expansion Operational Factors Competitive Factors Macroeconomic Factors Aggregate demand changes Supply chain diversification and differentiation Response from East and West coast ports A B C Economies of scale in shipping Structure of production changes Response from railways Shipping costs structure New gateways Slow steaming Response from Suez Canal and Med transshipment hubs
Global Shifts: The Unstable Structure of Production, Consumption and Distribution A Southeast Asia South Asia Indifference Point East Asia Westbound Route Eastbound Route Demand Saturation Regionalization Landbridge PanamaRoute
What Drives Supply Chain Management? Control Freaks B Added Value Efficiency Control Offshoring Costs / time / reliability Internalize efficiency
At the Crossroads… Which Value Proposition for the Caribbean? B 1) Strong margins, but many not large enough to justify dedicated services 3) East coast capacity issues 4) Last segment in import-based supply chains - + 2) Interlining between the America’s coastal systems
Share of the Northeast Asia – U.S. East Coast Route by Option: Transition Already Completed? B
Economies of Scale are a Bitch… B Port call sequence (less) Shipping network configuration (concentration) Transshipment (more) 2,800 TEU 4,200 TEU 12,500 TEU Which ship for which service? Photo: Dr. Theo Notteboom
B Conventional Direct NorthAtlantic Central Atlantic South Atlantic / Gulf Transshipment Circum-Equatorial NorthAtlantic NorthAtlantic Central Atlantic Central Atlantic South Atlantic / Gulf South Atlantic / Gulf Caribbean Transshipment Triangle
Slow Steamin’: What Hath You Brought Us? B Prince Rupert 12 Transit Times from Shanghai and North American Routing Options (in Days) Vancouver 4 13 8 5 Seattle / Tacoma Toronto Oakland 5 3 26 Chicago New York 13 Los Angeles 25 Norfolk Atlanta 5 14 Dallas Savannah/Charleston 5 25 Slow Steaming: More WC transloading More inventory in transit 28 Houston 8 19 Lazaro Cardenas 22 Panama
The Toll Conundrum: Potential Diversion between Intermodal and AWR for Asian Imports C The Toll Conundrum: Financial pressures versus maritime shipping pressures Current Expansion (unconstrained) Expansion (constrained) Toll increases have already captured 40% of the potential savings of the expansion. The appeal of revenue maximization (NOT traffic maximization). Yield management? Adapted from A. Ashar (2009)
Shipping Rate from Shanghai for a 40 Foot Container, Mid 2010 C Vancouver Montreal $2,300 $2,110 $4,040 $3,950 New York $3,700 $1,830 Los Angeles $2,620 $1,400 Inbound rates: function of distance Outbound rates: function of trade imbalances Houston $3,510 $2,560 Inbound Outbound $1,300 $2,100
Governance Changes in Port Authorities: Competing over the Hinterland C Conventional Port Authority Expanded Port Authority • Planning and management of port area. • Provision of infrastructures. Landlord Landlord Cluster Governance • Service Efficiency • Logistical Integration • Infrastructure and Growth Management • Terminal-City Integration Regulator Regulator • Planning framework. • Enforcement of rules and regulations. Operator Operator • Cargo handling. • Nautical services (pilotage, towage, dredging). Terminal Operator(s)
Intermodal Terminals and Recent Co-Located Logistic Zones Projects C Every rail operator involved. Partnership with a major real estate developer.
The North-American Container Port System and its Multi-Port Gateway Regions C 4 Multi-port gateway regions 1. San Pedro Bay 2. Northeastern Seaboard 3. Southwestern Seaboard 4. Puget Sound 5. Southern Florida 6. Gulf Coast 7. Pacific Mexican Coast 2 1 3 6 5 The Caribbean Gateway? 7
Conclusion: The Complexities of Divergence Operational Factors B Macroeconomic Factors A Aggregate demand changes, structure of production Supply chain diversification and differentiation, economies of scale, Slow steaming Panama Canal Expansion No expansion: High impact (trend reversal) Expansion: Maintaining existing trends (AWR) Response from East and West coast ports, hinterland factors, tolls Competitive Factors C