Consumer Price Index continued
160 likes | 329 Views
Consumer Price Index continued. With the consumer price index we’re able to compare prices and salaries from year to year.

Consumer Price Index continued
E N D
Presentation Transcript
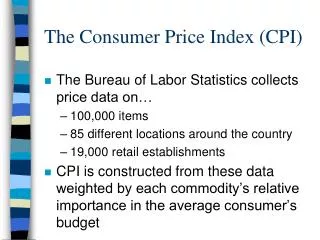
With the consumer price index we’re able to compare prices and salaries from year to year. Let’s say your grandmother made $15,000 per year in 1964 and your mother makes $37,000 per year in 2010 and you want to know if your grandmother made more or less than your mother. You can convert grandma’s actual $15,000 salary to 2010 Constant Dollars and see if it’s higher or lower than your mother’s.
Graphing Let’s say you make $100 every year for 10 years.
Actual vs. Constant Dollar Since the value of the dollar decreased each year, this graph is not a realistic depiction of your salary over this period. Constant Dollar Salary is not represented
Creating the Spreadsheet Let’s convert all of these values to 2010 constant dollars so we can see whether our $100 is keeping up with inflation
To Constant Dollar 2010 Salary To see the relative salary of 2001 in terms of 2010 dollars….
What if? You got a 1% raise each year? Actual Dollar graph? Constant Dollar Graph?
What if? You got a 3% raise? Actual Dollar Graph? Constant Dollar Graph?
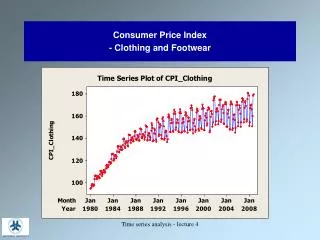
Graphing Has electricity become more expensive?
To Constant Dollar 1997 Price To see the relative expense of electricity in 1986 in terms of 1997 dollars….
Scenario for Electricity We saw what the graph looked like when the constant dollar price of Electricity went down relative to the rate of inflation. What would the constant dollar graph look like if electricity increased at the same rate as inflation?