Download
1 / 19
200 likes | 334 Views
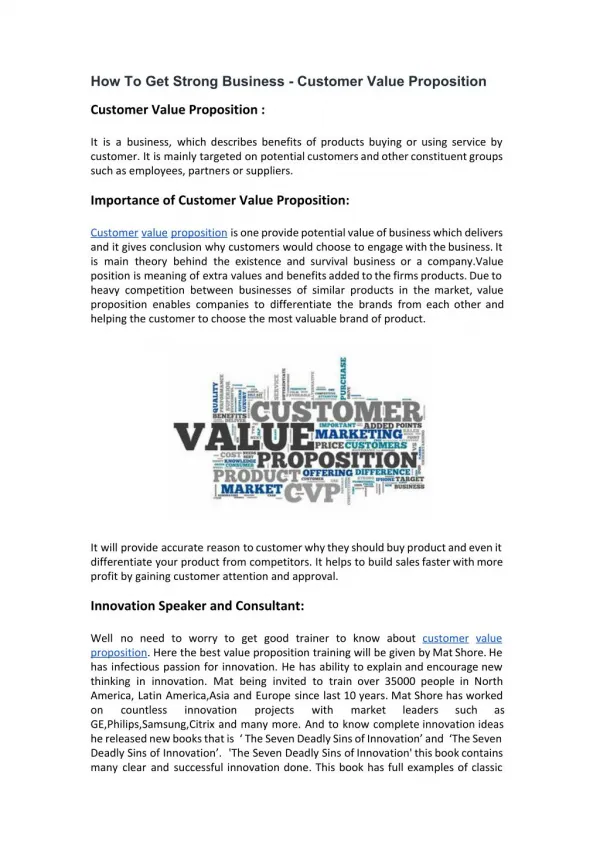
About Adeptia Business Model Value proposition Customers Architecture Product demonstration Sample Process Flow creation Questions and answers. Note: This is an informal session, please ask questions at any time. Adeptia was established in June 2000 Head Office at Chicago, Illinois.

E N D
About Adeptia • Business Model • Value proposition • Customers • Architecture • Product demonstration • Sample Process Flow creation • Questions and answers Note: This is an informal session, please ask questions at any time
Adeptia was established in June 2000 • Head Office at Chicago, Illinois. • Development and Marketing Office at India. • Solution focused company • Flagship product - Adeptia BPM Server • Major installations in Fortune500 companies
Business Process Management Server Software Technology Industry Solutions Custom Services Automobile Insurance Industry Solution Development Implementation Services
Manage: • Document business processes • Share and collaborate between business users and IT • Design • Automate: • Create individual tasks or services • Implement execution of process flows • Optimize: • Track and monitor • Analyze logs and reports to identify bottlenecks • Enhance and improve performance
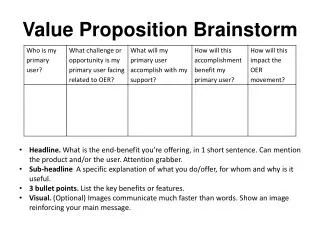
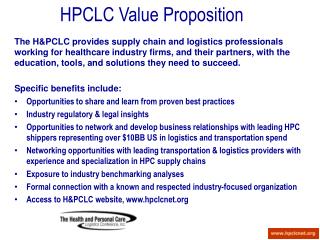
Improve profitability by reducing costs of B2B operations • Reduce time and effort in B2B integration by up to 75% • Increase productivity and leverage human capital costs • Improve competitive advantage • Introduce repeatable, reusable processes
Developers: • These are IT staff or consultants who use the BPM Server to design and implement process flows • Business Users: • These are end-users who benefit from the automation of business processes and interact with flows using workflow tasks • Design time: • This is the phase during which developers implement flows • Run time: • This is the phase when the process flows that have been implemented are run in production environment • Service: • This is a type of feature or specific business task or action • Activity: • This is an instance of a service which is actually executed in a flow • Process Flow: • This is a set of activities that combine together to create a business process
Process Designer Web-based User Interface Process Engine Schema/ MetaData Data Mapper Workflow Triggers Administration Mapping Engine Events Transport User-interface, design time Back-end, run time
Industry Accelerators: Standards-based data formats and processes ANY File Formats ANY Business Applications + Flat Files ERP Business Process Workflow Engine CRM XML Documents TRANSPORT HTTP(S) FTP JMS SMTP/POP3 ODBC/JDBC SOAP JCA TRANSFORMATION TRANSPORT HTTP(S) FTP JMS SMTP/POP3 ODBC/JDBC SOAP JCA Business Intelligence Business Rules RDBMS SCM Map Parse Transform ADMINISTRATION Logging, Tracking, Monitoring ANY Location EDI Documents Internal Depts. SCHEDULER / REAL TIME EVENT TRIGGERS Excel Files Customers Partners ebXML ANY to ANY Regulatory Bodies
Create Process flows by pulling BPM and Pre Built Activity List BPMN Pre Built Activity List
Activity Panel Create activities using SDK
Drag Drop Multiple Sources to Multiple Targets makes complex mapping very easy Define simple Mapping Rules
User selects X-Axis column, Y-Axis Column, Bar Chart component is generated appropriately User gives sql query (correct sql syntax) and the table component is generated Result of the Query is displayed User Query is displayed PIE chart component is generated with user based data source, and the columns required
Shows Currently Executing processes User can select from number of units, this is dynamic chart User can right click on any BAR and then abort the transaction
Gets Node specific Process Characteristics and memory usage which is constantly changing
Other solutions Custom coded , not proven technology Longer time to implement Highly complex Expensive with repeated up-gradation High Risk deployment Adeptia Benefits Powerful industry proven BPM & Integration No coding, rapid deployment Easy to use and manage High-value, cost effective, scalable Low risk, allows phased incremental approach