
Exercise metabolism
E N D
Presentation Transcript
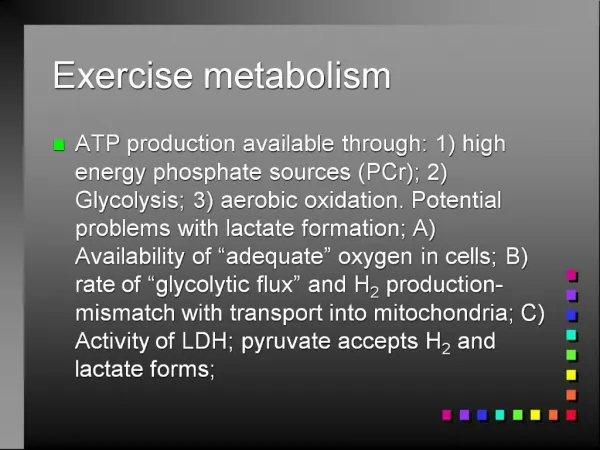
1. Exercise metabolism ATP production available through: 1) high energy phosphate sources (PCr); 2) Glycolysis; 3) aerobic oxidation. Potential problems with lactate formation; A) Availability of �adequate� oxygen in cells; B) rate of �glycolytic flux� and H2 production-mismatch with transport into mitochondria; C) Activity of LDH; pyruvate accepts H2 and lactate forms;
2. Metabolic Machinery Accepting pyruvate depends upon Mitochondrial reticulum (network). Activity of Krebs Cycle & Electron transport chain insulates cell from high pyruvate. Fiber-type specific LDH drives pyruvate to lactate. Fast-twitch fiber disadvantage for sedentary subjects.
3. 3-4
4. Response to Energy charge changes Rate of ATP production based on demand- Rising ADP and drop in ATP prime modulators.
Creatine Kinase-high energy phosphate controller;
Phosphofructokinase-glycolytic rate;
�Dehydrogenases� of Krebs Cycle;
Cytochrome oxidase of ETC controls rate of O2 acceptor of electrons in ETC.
5. Fuel Sources during Exercise Intensity and Duration dependent;
�Crossover Concept� -role of training status dictates how far into intensity spectrum fatty acids are predominate fuel source;
Transition from rest to exercise-O2 deficit? Impact on short-term moderate to hi intensity exercise.
VO2 drift with prolonged exercise.
6. Fig 3-5 & 3-8
7. Lactate Threshold Intensity dependent, training-specific change in metabolic response to exercise;
Implications for ventilation, CO2 and muscle & blood pH changes;
Ability to exercise at or above LT threatens exercise session.
8. 3-10
9. Ventilatory response Ventilatory threshold, anaerobic threshold, or Lactate threshold-
Evaluate rise in Ve, VCO2, and/or Ve/VCO2 ratio.
Jump in lactate concentrations in blood;
10. Recovery from exercise-EPOC Re-establish dynamic equilibrium of body at rest;
Core temperature; lactate metabolism; catecholamines; glycogen restoration; cardiac output,
Contributes to overall exercise energy expenditure.
Combines with exercise VO2 for total energy expenditure- VO2 & RER used to estimate kcals/ liter O2 consumed.
11. Normal Cardiorespiratory Responses to Exercise
12. Myocardial Response HR-influenced by SNS & PSNS & circulating hormones;
As HR inc. diastole dec. and systoles stays about same.
SV influenced by Frank-Starling mechanism/length-tension relationship of myocardial cells (Preload or LVEDV);
Effect of afterload may hinder ventricular performance.
Exercise inc LVEDV, small change in LVESV so SV increases.
13. 3-12
14. 3-13
15. Cardiac Output Table 3-3: HR*SV- big difference is in SV.
16. Peripheral Blood Flow MAP-balance of increased Q and greater vasodilation; Inc. cardiac output of heart raises SBP while peripheral vasodilation keeps diastolic fairly constant.
TPR-vessel radius changes-combined efforts of vasoconstriction in inactive tissue beds by SNS-alpha receptors, and local vasodilatory substances (Nitric oxide) and beta receptors of SNS.
Arm vs leg exercise also a factor.
17. Dynamic vs static exercise Table 3-2
18. Arms vs legs Absolute vs relative workload
Arms can do less work (65-80% of VO2max of legs, HR 10 bpm lower) than legs, so same absolute workload is at a higher % of arm�s capacity than legs. See greater HR, SBP, DBP, Ve, VO2, lactate with lower SV.
When arms & legs exercise at same relative workload, CV response quite similar.
19. Myocardial Work 3-15
20. Factors determining myocardial demand 3-16
21. Cardiorespiratory Adaptations to Exercise Training Pulmonary-limited improvements-likely result of other adaptations-perhaps at maximal exercise or reduced respiratory muscle fatigue in prolonged exercise; Less lactate in blood may lower ventilatory drive; greater diffusion capacity makes lungs more efficient.
Central Circulation-major change is greater SV. Blood volume expands which stresses ventricle, leads to larger ventricular cavity (LVEDV), greater ventricular mass improves Preload, which leads to greater SV.
Improved contractility-greater SNS stimulation or Ca++ dynamics in cell.
22. 22-1
23. Training and Blood Lactate changes 22-1
24. Peripheral Circulation Decrease in Total peripheral resistance;due to increase capillaries & improved vasodilator effects;
Greater shunting of blood from splancnic & kidneys to skeletal muscle; maintains central venous pressure & filling of heart;
25. 22-5
26. Specificity Principle 22-7
27. Muscle Adaptations Type of exercise dictates changes Endurance-oxidative enzymes-Krebs cycle, oxidases of ETC, shutttle of NADH2; fatty acid use (carnitine palmitoyal transferase); Glycogen and triglyceride storage; maintain lower ADP levels with more fuel choices;
Fiber type determines magnitude of changes;migration toward oxidative;