Download
1 / 22
220 likes | 384 Views
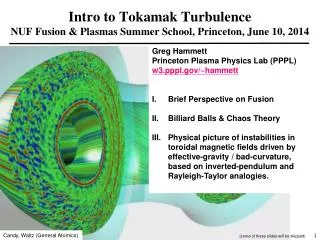
Measurements and analysis of turbulence in fusion plasmas. Nils P. Basse Plasma Science and Fusion Center Massachusetts Institute of Technology Cambridge, MA 02139 USA. ABB seminar November 7th, 2005. Curriculum vitae.

E N D
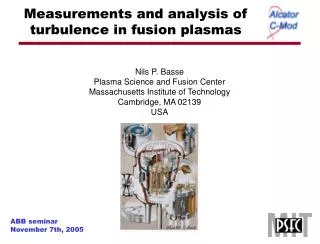
Measurements and analysis of turbulence in fusion plasmas Nils P. Basse Plasma Science and Fusion Center Massachusetts Institute of Technology Cambridge, MA 02139 USA ABB seminar November 7th, 2005
Curriculum vitae • 2002-2005: Postdoctoral Associate at the Massachusetts Institute of Technology, USA • 1999-2002: Ph.D. in physics from the Niels Bohr Institute at the University of Copenhagen, Denmark, including a total of two years work at IPP-Garching, Germany. The title of my Ph.D. thesis is: 'Turbulence in Wendelstein 7-AS plasmas measured by collective light scattering'. • 1996-1998: M.Sc. in physics from the Niels Bohr Institute at the University of Copenhagen, Denmark, including a one-year stay at JET, England, where I made my Master's thesis. • 1993-1996: B.Sc. in physics (mathematics 2nd topic) from the Niels Bohr Institute at the University of Copenhagen, Denmark www.npb.dk
Outline • Fusion energy • The Alcator C-Mod tokamak • Anomalous transport • The phase-contrast imaging (PCI) diagnostic • The low (L) and high (H) confinement modes • Analysis of turbulence in L- and H-mode
Fusion energy • Candidate fusion reactions on Earth: • D+T 4He (3.5 MeV) + n (14.1 MeV) • D+D 3He (0.82 MeV) + n (2.45 MeV)
C-Mod facts Alcator C-Mod is a divertor tokamak with high magnetic field capability (Bt 8 T) in which quite high plasma currents (Ip 2 MA) are possible in a compact geometry (R = 0.67 m, a = 0.22 m). Strong shaping options. Plasma densities well above 11021 m-3 have been obtained, but more typically the average density is in the range (1-5)1020 m-3. Auxiliary heating: Up to 6 MW ICRF (3 antennas, frequency between 50 and 80 MHz). Plasma facing components are made of Molybdenum.
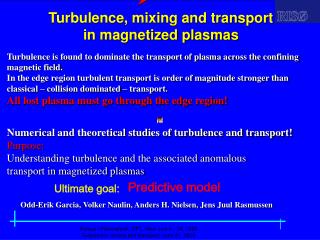
Anomalous transport • Plasma transport associated with particle collisions in a toroidal geometry is called neoclassical transport. • Experimentally, ion heat transport has been observed down to the neoclassical level. • However, electron heat transport and particle transport is typically 1-2 orders of magnitude above the neoclassical transport predictions: • This is called anomalous transport. • Anomalous transport is thought to be caused by plasma turbulence. • Turbulence causes fluctuations in most plasma parameters.
PCI facts • Measures line integrated electron density fluctuations along 32 vertical chords. • Sensitive to turbulence from 0.6 to 16.8 cm-1. • Radiation source is a 25 W CO2 laser, wavelength 10.6 m. • A phase plate converts phase fluctuations to intensity fluctuations. • Detector is a LN2 cooled linear array of photoconductive elements. • D-light diode viewing inner wall. • Poloidal magnetic field probe on outboard limiter.
Autopower spectracore channel Black is L-mode, frequencies multiplied by two. Red is H-mode Black is L-mode Red is H-mode
Frequency-wavenumber spectra all kR L-mode H-mode • By performing 2D Fourier transforms on the PCI data from all 32 channels, we arrive at frequency-wavenumber spectra. • The largest increase in frequency coverage from L- to H-mode is at large wavenumbers. • Negative (positive) wavenumbers are due to fluctuations travelling outward (inward) parallel to the major radius.
Frequency-wavenumber spectra kR = 5.2 cm-1 Black is L-mode, frequencies multiplied by two. Red is H-mode Black is L-mode Red is H-mode
Autopower-wavenumber spectra Integrating fluctuations over all frequencies we can plot wavenumber spectra for L- and H-mode. Black diamonds are L-mode. Red triangles are H-mode.
Correlationsbetween PCI and D/poloidal magnetic field D Poloidal magnetic field Cross correlation between rms D/poloidal magnetic field fluctuations and PCI band autopowers. Band autopower resolution 50 kHz, time resolution 0.5 ms. Positive (negative) time lag: PCI fluctuations occur before (after) the D/poloidal magnetic field fluctuations.
Conclusions • We have in this talk given a brief overview of magnetic confinement fusion and presented an analysis of turbulence measurements at a confinement transition in the Alcator C-Mod tokamak: • Turbulence is observed up to 2 MHz • Changes in broadband turbulence averaged over wavenumbers can be explained by Doppler shift (rotation) • The peaks in the wavenumber spectra indicate a specific forcing scale • Cross correlations with other fluctuations show two features separated by frequency • The international fusion program is rapidly evolving: • The Wendelstein 7-X stellarator is being built in Greifswald, Germany • The international thermonuclear experimental reactor (ITER), a tokamak designed to demonstrate the feasibility of fusion energy, will be built in Cadarache, France