nEDM @ PSI
530 likes | 735 Views
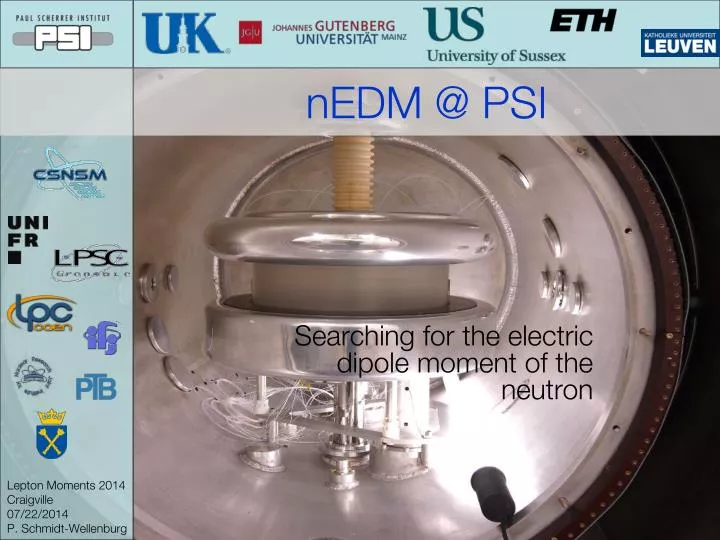
nEDM @ PSI. Searching for the electric dipole moment of the neutron. The collaboration. 14 Institutions Eight countries / 14 institutions 48 Members 11 PhD students. PSI in S witzerland. UCN source & EDM. Outline. The measurement technique.

nEDM @ PSI
E N D
Presentation Transcript
nEDM @ PSI Searching for the electric dipole moment of the neutron
The collaboration • 14 Institutions • Eight countries / 14 institutions • 48 Members • 11 PhDstudents
PSI in Switzerland UCN source & EDM
The measurement technique Measure the difference of precession frequencies in parallel/anti-parallel fields: Best nedm limit: 2.9×10⁻²⁶ecmBaker et al., PRL97(2006) fordn<10-26 Δω< 60 nHz ωL≈30Hz for B0=1μT
Ramsey resonance curve Sensitivity: • Visibility of resonanceT Time of free precessionN Number of neutronsE Electric field strength The Ramsey technique Spin “down” neutron... B0↑ Apply /2 spin flip pulse... B0↑ + Brf Free precessionat ωL B0↑ Second /2 spin flip pulse. B0↑ + Brf
Gravity 102 neV/m V Strong VF Magnetic ∼60 neV/T Ultracold neutrons (UCN) Storable neutrons (UCN) & systematic effects Storage properties are material dependent 350 neV ↔ 8 m/s ↔ 500 Å ↔ 3 mK E. Fermi & W.H. Zinn(1946), Y. B. Zeldovich, Sov. Phys. JETP (1959)389
PSI UCN source UCN storage volume Main shutter Neutron guide to experiments 1m UCN convertor (solid D2 @ 5K) Spallation target En~MeV Protons 590 MeV 2.2 mA D2O moderator Neutrons thermalized to 25 meV Golub, R. & Pendlebury, J. M PLA (1975)133 Anghel, et. alNIMA (2009)272
VAT VAT UCN source performance Standard operating Pulse Norm Pulse • 30 UCN/cm3 at beam exit(~550 000 UCN/25 liter) 1m glass tube UCN Counts /s Cascade Detector UCN - NiMocoating - Stainless steel flanges - shutter DLC coated
Filling UCN • Optimize product 14000 N (after 30s storage) Polarization
Simultaneous spin detection ~20% increase in sensitivity(for 2014)
Storage life time • Chamber made of dPS insulator ring and DLC electrodes • Two exp fit:ts~30stf~180s • Max no. UCN measured after 180s storage:10500
Transversal depolarization Best @ PSI T2(B0↓) : 1158 ± 94s T2(B0↑): 836 ± 63s 2013: T2(B0↓/B0↑)~600s → Excellent magnetic field homogeneity
Neutron EDM sensitivity ~7500 ~0.75 <2 2013 data taking: 3266 cycles 25 days Stopped by switch break down 2013 accumulated sensitivity 6×10-26 e.cm * Best nedm limit:Baker et al., PRL97(2006)
The measurement technique Measure the difference of precession frequencies in parallel/anti-parallel fields: Statistical accuracy of a magnetometer correcting for a change in B should be better than the neutron sensitivity per cycle:
Mercury co-magnetometer • Average magnetic field (volume and cycle) • σB~ 400 fT • τ > 100 s without HV • s/n ~ 500 without HV PM τ = 140s polarization cell B0 ≈ 1μT ¼ wave platelinear polarizer Hg lamps HgO source
UCN precession chamber PMT polarization chamber circular polarizer unit 253.7 nm UV light, circularly polarized Hg source Mercury co-magnetometer Goal: Measure magnetic field drifts via optically detected nuclear magnetic resonance (ODMR) with 199Hg atoms 50m ( M. Fertl, PhD-Thesis 2013) • Fourth harmonic generator (IR→VIS→UV) • Toptica TA FHG (20 mW @ 254 nm) • 50 m away from the nEDM setup
Hglaserreadout ( M. Fertl, PhD-Thesis 2013) Sensitivity improvement from ~400fT → <100fT
Frequency ratio R = fn/fHg • There are two drawbacks using the HgMas field monitor: • Center of mass offset • Non-adiabaticity UCN 199Hg m/s vs. m/s CsM - array + further sys.
Cesium gradiometer Monitoring of vertical magnetic gradients • Six HV CsM • Ten ground CsM • Stabilized laser • PID phase locked DAQ ±120kV … 1 2 6 7 … 15 16
Gradients from CsM • Field parameterized by 9 parameters (2nd order) • The parameters are adjusted to 12 magnetometers readings using least squares • Residuals are about 30pT(500pTusing only linear model) • Jackknife procedure to estimate the error on the gradient G
Extracting R = Run 6043 Χ2/dof = 1.3
R vs gradient B0 up B0 down
Frequency ratio R = fn/fHg • There are two drawbacks using the HgMas field monitor: • Center of mass offset • Adiabatic vs Non-adiabatic field sampling UCN 199Hg m/s vs. m/s CsM - array + further sys. Field maps
Transversal fields • Mapping with fluxgate and vector cesium magnetometer • -20<z<20, -10<r<30, Δφ = 5° UCNs: Adiabatic regime 199Hg: Non-adiabatic regime
Earth rotation correction B0up fEarth λ
Vector light shift in 199Hg Atomic energy levels are influenced by the interaction with light Spin dependent part can be by modeled as effective magnetic field (which only alters the Larmor frequency of the Hg atoms, not of the UCN) • Effective magnetic field depends on: • Light intensity • Light polarization • Light frequency • Light beam alignment B0 Beff BLS All four parameters have to be under control for reliable calculations.
Hg lightshift measurement • Change of light intensity 30% / 70% • Change of relative angle B-field / light beam 1.5 ppm -1.5 1.5 ppm -1.5
Result (submitted to PLB) γHg γn
Conclusion • The UCN source delivers sufficient statistics for data taking, potential improvements are being identified • The nEDM experiment is taking data, operational reliability has been improved during shutdown 2014 • As a test of magnetic field control we have measured the most precise gyromagnetic ratio of mercury-199 and neutron. • We expect with 300 data-days until 2016 a statistical sensitivity of σ≲10-26 e⋅cm
Measurements on beam West-1 Standard operating Pulse Norm Pulse UCN Counts /s detector 1 Cascade UCN detector
Cs OPM Servo
Cs vector magnetometer Bx 10 – 20 pT By Bz 400 fT |B| 75 fT
Analysis of a run The analysis: Ramsey Fit Cut on cycles with residuals larger than 3 (10 %) Typical χ2=1.5 a Mercury frequency
UCN depolarization Measurement of frequency ratio R asfunction of vertical gradient revealed unexpected polarization behavior and non-linearity for large gradients.
Hglaserreadout ( R&D for n2EDM, tested in nEDM ) Sensitivity improvement from ~400fT → ~100fT
Gravitationally enhanced depolarization • Ultracold neutrons with different energies average differently over the storage volume • UCN with low energies, will depolarize faster: • contribute less to the average field measurement, • frequency changes non-linear Figures from:P. G. Harris et al, PRD89, 016011(2014)
Side remark: nEDM sensitivity 2013 data taking: 3266 cycles 25 days Stopped by switch break down 2013 accumulated sensitivity 6×10-26 e.cm *Best nedm limit:Baker et al., PRL97(2006)
Magnetic fields B0 BT
Gradients from CsM • Field parameterized by 9 parameters (next-to-linear) • The parameters are adjusted to 12 magnetometers readings using least squares • Residuals are about 30pT(500pT using linear model) • Jackknife procedure to estimate the error on the gradient G
Earth rotation correction B0up fEarth λ
A new limit gSgP 2 4:8 1027