Download

1 / 14
140 likes | 248 Views
THE ZIMBABWE ECONOMY Recovery Challenges Presentation by John Robertson. AGRICULTURE Sales Volume Indices: 1997=100. INDEX: 2000=100. Robertson Economic Information Services. ZIMBABWE’S FOOD IMPORTS Percentages of Total: 2000 to 2007. % OF TOTAL IMPORTS. FOOD IMPORTS. Estimates.

E N D
THE ZIMBABWE ECONOMYRecovery ChallengesPresentation byJohn Robertson
AGRICULTURESales Volume Indices: 1997=100 INDEX: 2000=100 Robertson Economic Information Services
ZIMBABWE’S FOOD IMPORTSPercentages of Total: 2000 to 2007 % OF TOTAL IMPORTS FOOD IMPORTS Estimates Source: CSO & IMF
MINING PRODUCTION BASE METAL & MINERAL ORES TONNES Robertson Economic Information Services
MANUFACTURING All GroupsAnnual Indices INDEX: 1990 = 100 - 82% Robertson Economic Information Services
TOTAL EXPORTSUS$ Value of Annual Shipments US$’millions per year Robertson Economic Information Services
BALANCE OF PAYMENTS2010 Projections $1,5 billion B of P Gap IMPORTS $3,4 billion Billions of US dollars EXPORTS $1,9 billion Source: Ministry of Finance
TOTAL FORMAL EMPLOYMENTAnnual Averages LOWEST FIGURE SINCE 1970 Thousands of Employees *Estimates Robertson Economic Information Services
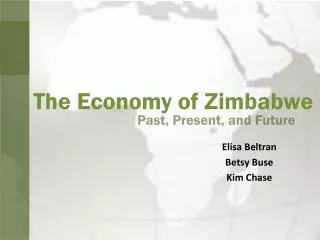
ZIMBABWE:GDP ANNUAL % CHANGE LAND REFORM Source: CSO + IMF + Robertson Forecasts
GDP COMPARISONS:Southern African Countries US Dollars per Head per Year Source: IMF Africa Dept & World Economic Outlook
Gross Domestic PRODUCTper Head, Ireland compared to Portugal & Zimbabwe Zimbabwe needs more companies GDP PERCENTAGE ACHIEVED COMPANIES COMPANIES
Gross Domestic PRODUCTper Head, Ireland compared to Portugal & Zimbabwe NOT just the change of ownership of the few we already have GDP PERCENTAGE ACHIEVED COMPANIES COMPANIES
ZIMBABWE’S GDP –COMPARISON WITH PORTUGAL 98% UNREALISED POTENTIAL PORTUGAL PERCENTAGE ZIMBABWE
POPULATION GROWTH 1890 TO 1990 POPULATION GROWTH: 20 – FOLD IN 100 YEARS POPULATION OF ZIMBABWE