Download
1 / 33
330 likes | 482 Views
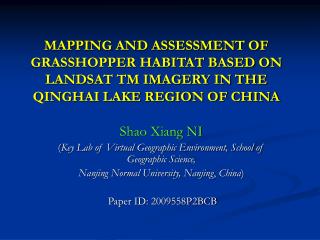
MAPPING AND ASSESSMENT OF GRASSHOPPER HABITAT BASED ON LANDSAT TM IMAGERY IN THE QINGHAI LAKE REGION OF CHINA. Shao Xiang NI ( Key Lab of Virtual Geographic Environment, School of Geographic Science, Nanjing Normal University, Nanjing , China ) Paper ID: 2009558P2BCB. INTRODUCTION.

E N D
MAPPING AND ASSESSMENT OF GRASSHOPPER HABITAT BASED ON LANDSAT TM IMAGERY IN THE QINGHAI LAKE REGION OF CHINA Shao Xiang NI (Key Lab of Virtual Geographic Environment, School of Geographic Science, Nanjing Normal University, Nanjing, China) Paper ID: 2009558P2BCB
INTRODUCTION • In China, rangeland grasshoppers (Orthoptera: Acrididae) have brought serious harms to livestock farming and induced many environmental problems. • During the past period, a great deal of effort based on the conventional methods has been made to monitor the occurrence and plague of grasshoppers. However, good results have not achieved because of remote location and bad accessibility, and insufficient funds and facilities.
Since early 1970’s satellite image data have been used in monitoring migratory locust in many regions. • In these works, locust monitoring was conducted through its ‘habitat’. It means that a correlation analysis was carried out between habitat features and locust activities and, therefore, locust occurrence probability was estimated. • However, the similar method has not been used for grasshopper monitoring.
2 STUDY AREA • The Qinghai Lake region is located in Qinghai Province ,China (Fig. 1) with the elevation ranging from 3 200 m to 4 200 m above sea level. • The region is a very important sheep grazing base. However, grasshoppers have made harms not only to grassland, but also induced environment issues.
3 DATA AND METHODS • 118 sampling sites were selected and investigated in July to August, 2000-2003. At each site, data of landform, vegetation, soil and moisture condition were collected, and grasshopper density was estimated. • The data of temperature, precipitation and evaporation of these sites were obtained from local meteorological stations or through field observation • A database was established for the follow-up analysis. • Landsat TM image data were radiantly and geometrically corrected, and the grasshopper habitats were classified by Gaussian maximum likelihood classifier.
After that, assessment on grasshopper habitats in terms of probable grasshopper occurrence was conducted. • Firstly, an index system was designed, which was consisted of the habitat elements, i.e., topography, vegetation and soil, and their ratings with indices representing grasshopper occurrence probability. • Moreover, 12 test sites were randomly selected and assessed using the index system and the in situ data collected in field to test the method.
4 RESULTS AND DISCUSSION • 4.1 grasshopper habitat Classification 4.1.1 Classification scheme The features of a given type of grasshopper habitat are closely related with landform, soil properties, moisture conditions, vegetation type.
Grasshopper habitats belong to a same type are similar in grasshopper species and density. • Using the data collected in field, a classification scheme of grasshopper habitat (Table 1) was designed and used in grasshopper habitat classification from Landsat TM images.
4.1.2 Image Classification of grasshopper habitat • A supervised classification for grasshopper habitat on TM image was conducted based on the training data collected from 189 sampling sites. • After that, a spectral statistics for the training data was obtained (Fig. 2), and was used in grasshopper habitat classification. • Finally, a check on classification accuracy was carried out at 50 randomly selected sites, with an overall accuracy of 84.23% achieved.
SKs ASs Fig.2 Spectral statistics of the training data SKs ASs
MM SPs SPs MM
HC meadow HCs HC HCs
AF AF
4.2 Grasshopper habitatassessment • 4.2.1 Assessment method • An index system used for grasshopper habitat assessment was established (Table 2).
Based on this index system, a grading scheme for grasshopper habitats in terms of grasshopper occurrence probability was established (Table 3).
4.2.2 Verification on the method • In order to verify the index system and the grading scheme, a total of 12 test sites were selected randomly from the study area and the field check was carried out. The result was showed in Table 4. Table 4 Grasshopper habitat assessment of the selected sites
*Code:ASs (Steppe dominated by Achnatherum splendens); HCm (High-cold meadow); HCsm (High-cold shrub meadow); SKs (Steppe domi. by Stipa Krylovii); SPs(Steppe domi. by Stipa purperea). **GD--Grasshopper density (heads/ m2) observed in field.
Table 4 shows that: 1) In total 12 test sites, there are 8 sites which demonstrated a good relation between grade value (F) calculated from the grading scheme and grasshopper density observed in field.
2) Of the remaining 4 sites, there are 3 sites (No. 4, 31 and 34) which have grasshopper density observed in field lower than the theoretical value coming from the assessment. • Field check indicated that its major reason was that these sites experienced chemical spray for grasshopper control just in the previous year.
3) Test site No.5 showed also deviation from the normal value, and its reason needs further investigated. • From the results it can be concluded that the method for grasshopper habitat assessment is generally feasible.
5 CONCLUSION • From the research carried out in the Qinghai Lake region, China it could be concluded: The Satellite image data assisted grasshopper habitat classification and the approach of grasshopper habitat assessment in terms of its occurrence probability is valuable and quite feasible to grasshoppers control.
ACKNOWLEDGEMENTS • The author would like to express sincere thanks to Dr. J. J. Jiang, Dr. J. C. Wang, Dr. Y. Zha and Dr. Y. C. Wei at School of Geographic Science, Nanjing Normal University and Mr. A. Q. Gong, Mr. S. H. Zhang and Mrs. W. J. Wang at Qinghai Provincial General Grassland Station for their helps in the study.