Download
1 / 58
580 likes | 760 Views
What is a Rogue Wave ?. The “Design Wave Philosophy’’ Calculation of the design wave Wave forces on semi-submersible platforms Wave forces and bending moments in FPSO-ships Platform movements in large waves Examples of heavy weather damage ***** What is a Rogue Wave ? *****

E N D
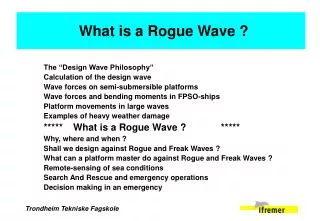
What is a Rogue Wave ? The “Design Wave Philosophy’’ Calculation of the design wave Wave forces on semi-submersible platforms Wave forces and bending moments in FPSO-ships Platform movements in large waves Examples of heavy weather damage ***** What is a Rogue Wave ? ***** Why, where and when ? Shall we design against Rogue and Freak Waves ? What can a platform master do against Rogue and Freak Waves ? Remote-sensing of sea conditions Search And Rescue and emergency operations Decision making in an emergency
What is a rogue wave ? • The various definitions • What are the problems for design ? • What are the problems for operations ? • What are researchers working on ?
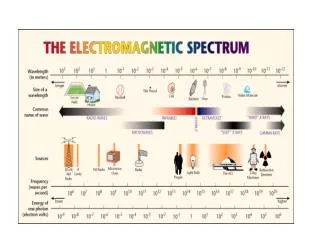
What is a rogue wave ? Let’s start with “What is a Wave ?”
What is a rogue wave ? In practice, you know it was a rogue wave once you saw it.
What is a rogue wave ? A good excuse when crew failed to install port hole storm covers ?
What is a rogue wave ? A 15° roll of the camera angle ?
What is a rogue wave ? Just something that happens ?
What is a rogue wave ? In physics and/or statistics, there are several definitions:
What is a rogue wave ? Some say a wave that is more than twice the significant wave height, but that may not be a reliable definition.
What is a rogue wave ? • If significant wave height was constant and equal to 10 meters, one would encounter a wave of: • 18.5 m every 3 hours • 21.5 m every day • 25.0 m every month • 27.5 m every year • 30.0 m every 20 years • 31.5 m every 100 years • 33.1 m every 1000 years • 34.8 m every 10000 years • The maximum in one day is also the maximum in the 20 minutes or 3 hours surrounding it, so twice the significant wave height is by no means abnormal: it happens every day !
What is a rogue wave ? One of those waves in a [large] set of a given height that make the set more numerous than it should be from conventional theory.
What is a rogue wave ? From the figures above, theory states that there should be 500 waves above 2Hs in a year. If one measures 1000 of them, they are rogue waves: about 500 freak and 500 normal extremes and of course we can’t distinguish easily which are which.
What is a rogue wave ? A wave of unexpected severity given the prevailing sea conditions at the time it occurs
What is a rogue wave ? A wave of unexpected severity given the prevailing sea conditions at the time it occurs. Unexpected: A good deal of damage can be avoided if those exposed are fully aware there and then. Severity: Steepness, Front steepness and other characteristics may be more damaging than mere height.
What is a rogue wave ? The famous “Draupner wave” Reconstructed water surface elevations over a 1000 m span, from T-30s (blue) to T (red) for the New Year Wave.
Where does it come from ? Georg tells us (Lindgren, 1970) that if it comes from the normal gaussian process, it is a wave that looks in retrospect like the autocorrelation function of the water surface elevation signal. Sverre (Haver, 2000) states that it is a freak wave if it represents an outlier when seen in view of the population of events generated by a piecewise stationary and homogeneous second order model of the sea surface process, otherwise “only” rogue. Miguel and Al (Onorato & Osborne, 2005) tell us that according to the Schrödinger equation, it sucks energy from its neighbors and thus it is a freak invader from an outer statistical population.
It is nice to be able to recognize a Freak or Rogue Wave in the statistics after it occurred... ...For various reasons, a much nicer ability would be that of being successful when speculating that approaching waves are not rogue waves, or even that they are. ‘‘ When a woman at a party asks me what I do, I invariably say «I ’m just a speculator.» The encounter ’s over. The only worse conversation stopper is «I ’m just a statistician.» ’’ Victor Niederhoffer, The Education of a Speculator, Wiley, 1997
Where does research stand with regards to rogue waves : recent studies. A wave is coming. In order to predict its rogueness, should we use quasi-deterministically the non-linear Schrödinger equation or merely rely on the statistics derived from, for instance, Slepian processes ?
Discriminating questions: 1. Do we have more high waves than our conventional long-term statistical models predict ? 2. When we do have high waves, do other characteristics of the whole storm, of the sea state, or of the few previous waves look different from those of other storms, sea states, or sets of a few consecutive waves ? 3. Especially, do characteristics related to theoretical deterministic constructions of rogue waves exhibit statistical evidence of predictive power ?
Database: 20 years of data available from Frigg QP platform in the North Sea
Database: 1979-1989: mostly 3-hourly measurements, many time-series available. 1991-1999: mostly 20-minute statistics, only reduced parameters
Database: Hmax and H1/3 retrieved preferably from the time-series when available (7%), from the statistics elsewhen. For storms, missing zero-crossing period information was derived from T1/3 (9.4%) and drawn from the empirical H1/3-Tz distribution when no information at all was available (1.7%). The final database consists of 265147 statistical records, it is thus equivalent to nearly 9 years of continuous measurements.
EKOFISK, operated by ConocoPhillips Laser measurements at the time of the ”Varg incident” Norway North Sea
Storm “freakiness” We (Olagnon & Prevosto, 2005, Olagnon & Magnusson, 2004) tried to investigate the widest time-scale: the whole storm. Especially, the maximum wave expected in a storm is a more useful forecast to seafarers than the maximum wave in some particular 1- or 3-hour duration sea state of that storm. It may thus appear natural to relate the maximum wave in a storm to the maximum predicted H1/3 in that whole storm rather than to the prevailing H1/3 at the precise instant of Hmax.
Storm “freakiness” Storms are defined as durations > 12 hours with H1/3> 5m
Storm “freakiness” For each of the 187 identified storms, 1000 random simulations were made using the database statistical parameters and a Jonswap wave spectrum with gamma=3. Second order correction was then applied to all computed Hmax values. Freakiness of a storm is defined as the quantile rank of that storm’s observed Hmax/ H1/3max in the corresponding distribution over the 187 actual storms (empirical) and over the 187000 simulated storms (2nd order theory).
Storm “freakiness” QQ-plot of Hmax/ H1/3max = blue dots. H1/3 = green dots Hmax = red dots Apart from a very few ones, storms are less “freaky” than 2nd order theory would predict.
Storm “freakiness” QQ-plot of Hmax/ H1/3max = blue dots. Mean storm BFI = red dots Benjamin-Feir instability at the time-scale of a storm can only be very weakly related to its “freakiness”.
Storm “freakiness” Expectations based on experience rather than theory would be definitely too low: An explanation for so many freak waves reported ?
Medium term: the sea state time scaleFreaky sea states ? Nerzic & Prevosto (98) proposed a Weibull-Stokes model for the distribution of maximum waves Hmax in a sea state, conditional to H1/3 and Tz of the sea state. They used a 7% subset of the Frigg database, without any special emphasis on extremes, to derive their model. We use the full database to study how the model performs with long-term extremes.
Distribution of maximum wave heights No underestimation by model ! Again, an appropriate transformation, limited to taking into account standard non-linearities up to second order, is sufficient to explain the observed extremes Comparison of empirical distribution of Hmax with Nerzic & Prevosto model for H1/3>5 m.
Kurtosis and Benjamin-Feir instability “When a similarity connection is achieved between two objects to 20 decimal places, the greater will move to the lesser” A.E. Van Vogt, The World of Null-A, 1945 Even though conventional Hmax models seem acceptable for long-term distributions, it might be possible to predict when the extremes in the distribution are most likely to occur : at those times, the similarity between the actual world and the theoretical deterministic world of non-linear Schrödinger equation may be such that we can apply the rules of the latter for some limited time-space window. In that latter world, extremes are governed by Benjamin-Feir instability.
Kurtosis and Benjamin-Feir instability Benjamin-Feir instability, i.e. the ratio of steepness to bandwidth, and signal kurtosis are strongly related (Mori & Janssen 2005)... … but are kurtosis (BFI) excursions away from regular values the cause of freak waves, or a mere consequence of their observation ? In other words, is kurtosis (BFI) a predictor or only a detector ?
Kurtosis and Hmax Hmax/ H1/3exhibits a clear relationship to kurtosis...
Kurtosis and Hmax …but if “kurtosis” is computed with removal of the largest wave’s time-duration, the relationship can no longer be seen.
Mostly based on Benjamin-Feir instability, and we just saw not conclusive. What value in Met’Offices warnings ? Difficult to assess how good the chosen omens are. Difficult to find volunteers to go into the worst areas of storms and validate the forecasts...
What is there to be seen a few waves ahead ? Instantaneous Benjamin-Feir instability index: nothing. H H1/3 BFI Index
What is there to be seen a few waves ahead ? Irregularity factor ( # of crests / # up zero crossings ): nothing. H H1/3 Irr. Fact.
What is there to be seen a few waves ahead ? Steepness: let’s have a closer look. H H1/3 Steepness
What is there to be seen a few waves ahead ? Crest H1/3 Steepness H H1/3 Steepness NOTHING AGAIN !
Conclusions so far • Extreme waves are not found more frequently than conventional long-term distribution models predict. • When extremes are observed, no abnormal characteristic can be found in non-directional parameters at the time scale of the whole storm, of the sea state or of a set of a few consecutive waves. There is nothing more in rogue waves than what we can see in the statistics.
A small ship usually climbs up the wave... Associated risks
…but may get rolled over or caught from the back. Risks for small ships
Flooding of the bridge or control room Risks for small ships
Get green water in addition to white on the foredeck... Risks for larger ships
…and water weighs a lot ! “for a while until they got it squared away, we launched them sailing backwards…” Risk for larger ships
Breaking of the structure due to sagging or hogging, in the trough or on the crest. Risks for larger ships
Only areas where there are more ships at risk... Risky areas ?