Download
1 / 35
350 likes | 520 Views
electron spin resonance study in a wide parabolic quantum well Russ Bowers Associate Professor of Chemistry University of Florida, Gainesville and National High Magnetic Field Lab. Acknowledgements Dr. Josh Caldwell – presently at Naval Research Lab – please visit poster!!

E N D
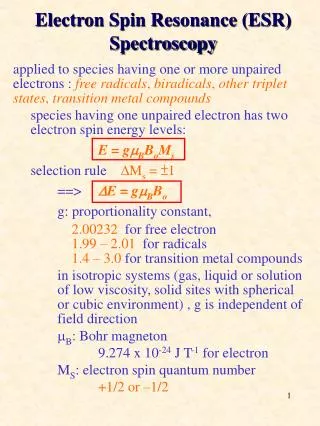
electron spin resonance study in a wideparabolic quantum well Russ Bowers Associate Professor of Chemistry University of Florida, Gainesville and National High Magnetic Field Lab
Acknowledgements • Dr. Josh Caldwell – presently at Naval Research Lab – please visit poster!! • Dr. Alexey Kovalev – presently at Pennsylvania State University Dept. of Electrical EngineeringProfessor Guennadii Gusev, Departamento Física dos Materiais e Mecânica, University of Sao Paulo, Brazil • funding • National Science Foundation grant DMR-0106058. • CNPq (Brazil) / NSF International Cooperation Program. • University of Florida Division of Sponsored Research.
“The ability to create nanometer-sized nuclear spin distributions combined with long solid-state nuclear spin lifetimes has important implications for the future of dense information storage, both classical and quantum. In addition, control over highly localized interactions between conduction electrons and lattice nuclei may provide a means to manipulate such information.” - D. Awschalom PRL (2003) 91 article no. 207602
g-factor variation in a PQWtime-resolved optical Faraday rotation detection realization of electricallytuned g-factor in a PQW Poggio et al, PRL (2003) 91 article no. 207602
g-factor variation inbulk AlxGa1-xAs In a PQW, the local g-factor varies along zdue to variationof Al fraction. conduction electronspin resonance data Weisbuch and Hermann, PRB B15 (1977) 816.
Can g-factor control be integrated with conventional solid state electronics? The Awschalom demonstration employed optical techniques… but in the context of EDESR? The answer is YES!!
first demonstration of electrically detected g-factor tuning H.W. Jiang and E. Yablonivitchdemonstrated g-factor tuning in a gated Al0.3Ga0.7As/GaAsheterostructure. However, the tuning range wasrelatively small…about +.8% or -0.5%. H.W. Jiang and Eli Yablonovitch PRB, 64 (2001) article no. 041307 (R).
Remotely doped wide parabolic quantum well (WPQW) • Potential V=az2 mimics a uniform 3D charge n+ proportional to the curvature. • Effective potential in loaded well has no central barrier • wide, uniform layer of high mobility carriers • modest gate voltage can induce large displacements of wavefunction • permits tuning of the electronic g-factor over wide range. • unique properties for spin-based semiconductor devices • i.e. spintronics, spin quantum computing • model system to study 3D many body effects in high magnetic fields. • high mobility, uniform electron density • g-factor tuning in the context of EDESR has yet to be demonstrated in a WPQW.
Parabolic potential mimics a uniform change n+, electrons attempt to screen A.J. Rimberg and R.M. Westervelt PRB 40 (1989) 3970.
Calculation of the bound statesand electron density distribution for a 4000Å WPQW (AG662). • (b) Calculated g-factor in each subband i.
100Å 4000Å 100Å x=.29 x=0.2 x=0.1 x=0.0 x=0.1 x=0.2 x=.29 Al.31Ga.69As Al.31Ga.69As Al.31Ga.69As Al.31Ga.69As 4000Å WPQW structure(sample AG662) 25Å GaAs/AlxGa1-xAs superlattice before illumination after illumination We ~ 3000Å 4000Å
B z 250Å @ 1 Tesla The tilt angle q might be expected to have a big effect in a WPQW high perpendicular field (q=0o) Usual expression for a 2DES at high magnetic field (neglecting spin…) Magnetic confinement dominatesover the quantum well confinementbecause the cyclotron diameter << well width Identical to the energy levels of a 3DES quasi-3D. high parallel field (q=90o)
at high field, bulk Landau levels. Shayegan et al. Appl. Phys. Lett. 53 (1998) 791.
transport properties4000Å WPQW (AG662) 3DES depopulaton of lowest LL 2DES
In high B, changing the density increases the occupancy of thehigher subbands. low density, g-factor determinedby ground state high density, g factor decreases due to contribution ofexcited states averaging assumeselectron exchange rate is fast compared to electron Larmor frequency.
coax rf-field z ac current y x experimental configuration coax m-wave field B Vxx
g-factor temperature dependence 300Å GaAs/Al0.1Ga0.9Assquare well EA124 (60o) ~5.5 T, n=1 WPQW (AG662) 6.5T, q=90o (parallel field) |g| |g| -0.6 % change
-0.6 % change in g-factor over 210K range Lower g-factor at higher T is consistent with increased i>1 sublevel occupancy.
temperature dependence of ESR linewidth 300Å QW (EA124,) ~5.5 T, n=1, q=60o WPQW (AG662), 6.5T Trend in line broadening is opposite for B vs. perpendicular orientation.
partially filled well EF regions of lower g-factor become occupied decreasing g-factor g-factor broadening increaseddensity EF completely full well n(z) z
DRxx (amplitude) temperature dependence WPQW (AG662) 300Å QW (EA124,) ~5.5 T, n=1, q=60o up down • Much weaker T-dependence in parallel orientation. Signal could be observed all the way to 10 K. • in 2DES, similar to narrow QW sample.
g-factor anisotropy in a 150Å GaAs/Al0.35Ga0.65As QW M. Dobers, K. v. Klitzing, G. Weimann, Solid State Comm. 70 (1989) 41-44. N=0
G-factor anisotropy in a 2DES is due tonon-parabolicity of conduction band Energy spectrum: diamagnetic term Spatial extent of wave function. Linear relationship between g-factor andLandau level energy was assumed:
n=36.65 GHz g-factor anisotropy in the WPQW g=g0-cB g-factor anisotropy ~ 5%. monotonic decrease with q
qualitative interpretation: g-factor decreases monotonically with increasing tilt angle. diamagnetic term dominates at all angles in lowest landau level. especially true for WPQW much larger in 400nm well compare to 15nm well Anisotropy of g-factor in B|| smaller than expected • calculated g0 should be -0.275. actual: -0.428 • selectivity for detection in central layers of high mobility
dynamic nuclear polarization in PQW DNP in the q3DES closely resembles DNP in the 2DES WPQW and 30nm QW Direction of DNP establishes g<0.
Overhauser shift decay in high parallel field Temperature independent nuclear spin relaxation in q3DES
q3DES 2DES 3DES, T1n temperature independent. 2DES, Korringa law: A. Berg, M. Dobers, R.R. Gerhardts, K. v. KlitzingPRL, 24 (1990) 2563. for kT << G where
filling factor dependence of T1n around n=1 WPQW (AG662) 150Å Al.35Ga.65As/GaAs QW A. Berg, M. Dobers, R.R. Gerhardts, K. v. KlitzingPRL, 24 (1990) 2563.
Fig. 11. Frequency swept MDENDOR - see poster for details 5.0 4.8 71Ga 75As 69Ga 4.6 4.4 4.2 DRxx (W) 4.0 3.8 3.6 3.4 3.2 42.6 42.7 59.8 59.9 75.9 76.0 MHz But no 27Al signal!!!
Fig. 12. (a) AG662 (b) AG662 DRxx (W) (c) EA124 (d) EA124
The solid blue curve is the angle dependence observed in a sample subjected to planar stress. Green symbols represent the splitting in the 30nm QW. Splitting due to selective detection in the band bending region? MDENDOR OPNMR
The lowest Landau level, illustrating the change in EFG with filling factor. Representative spectra illustrating the filling factor dependence of the 75As spectrum in EA124.
conclusions • Increased linewidth in parallel field vs. perpendicular field. • g-factor anisotropy, ~ 5% • g-factor decreases monotonically over 090o. • in parallel field, detection is selective to higher mobility layers near center. • Mechanism of EDESR may be different in q3DES than in the 2DES • No Al-27 NMR despite good S:N on other isotopes. • Korringa Relaxation in 2DES, T-independent Relaxation in q3DES • broadening in MDENDOR spectrum could result from heterogeneousband bending across z.