Download
1 / 43
430 likes | 450 Views
Explore the definitions, types, and rates of unemployment, as well as the effects of inflation on consumers and producers in the macroeconomic context. Learn about underemployed, discouraged, and full employment concepts.

E N D
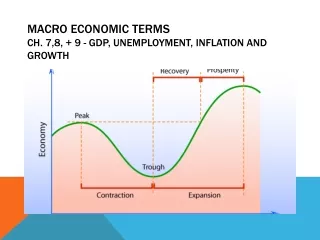
Macro Economic TermsCh. 7,8, + 9 - GDP, Unemployment, Inflation and Growth
Impact of Unemployment • For individuals extended periods of unemployment can lead to lower incomes, poverty, as well a variety of social problems such as alcoholism, divorce, etc. • At a macroeconomic level unemployment means that the there is an underutilization of resources and a decreased output (goods and services) for the entire society. • Lowest rate of unemployment was at end of WW II at 1.2% • Highest rate of unemployment was in Great Depression at almost 25%
Definition of Unemployment • Unemployment is defined as those people in the civilian labor force who are looking for work, but cannot find a job. Therefore, the definition of the civilian labor force becomes very important. Let’s look at who is counted in and out of this concept.
Who is in and who is out of the civilian labor force? • OUT • People in military (not counted in civilian labor force) • People taking care of the home if unpaid (e.g. house wife) • High school students under 18, working part time • People “working under the table” • IN • People working in private sector jobs • People working in public sector jobs • Unemployed people, seeking work
The Unemployment Rate • Unemployment rate is determined by the number of people in the civilian workforce actively seeking work, but unable to find jobs. • Unemployment rate = unemployed/civilian workforce x 100 • For example 9,000,000/100,000,000 = .09 • .09 x100 = 9% unemployment rate
You calculate the unemployment rate with the following statistics: • Labor force is 2000 workers • Unemployed is 120 workers • What is unemployment rate? • 120/2000 = .06 and .06 x100= 6 or 6% • Your turn: make up an unemployment problem and have your neighbor solve it.
The Underemployed and Discouraged Workers • The underemployed are those people who have jobs, but who work part time or below their skill level • Discouraged workers are those people who have given up looking for jobs. Their numbers not included in the labor force or unemployment statistic. • The over employed are people working two jobs or over 40 hours per week.
Calculate the Unemployment Rate • Population 500 • Military 50 • Employed 200 • Unemployed 50
Calculate the Unemployment Rate • Total population 300 million • Employed persons 180 million • Unemployed persons 20 million What is the unemployment rate? 20/200 = .1 x 100 = 10%
Calculate the Unemployment Rate • Total population 300 million • Civilian Labor Force 180 million • Unemployed persons 20 million What is the unemployment rate? 20/180 = .11 x 100 = 11%
Types of Unemployment • Frictional unemployment is temporaryunemployment of workers moving from one job to another. • Seasonal unemployment is linked to seasonal work (e.g. farm workers) • Structural unemployment is due to the decline of industries, so that workers no longer have necessary job skills. (Steel workers laid off due to decline of Steel industry don’t have computer skills for new jobs) • Cyclical unemployment has to do with job loss due to a recession.
“Full Employment” • Economists do not assume 0% unemployment as full employment • They argue that there will always be a certain level of frictional unemployment as people move between jobs in a free market place • The government currently describes “full employment” as between 4 and 6 percent.
The Natural Rate of Unemployment • Economists argue that there is a natural rate of unemployment once the labor market is fully adjusted in the long run. • The natural rate is calculated to exclude the cyclical unemployment created by the business cycle, but does include frictional and structural unemployment. • Economists have not been able to agree what this “natural rate” should be. It has been estimate to be as high as 6.5% or as low as 4%
Why did the price of the candy rise in the second round? • What was the price of candy in the first round? • What was the price of candy in the second round?Why did the price of candy rise in the second round? • Was the DaveDollar worth more or less in the second round? • What can you deduce from this activity is the impact of price rises on consumers?
Prices and Inflation • Inflation is a general rise in prices. • A short term rise in a specific commodity like oil may lead to inflation. • However, economists also look at many other products. In some cases the drop in some product prices may mean that there is not a net increase in prices to the consumer. • Deflation is the general drop in prices.
Impact of price changes • The main problem with inflation is that it decreases the purchasing power of consumers. • A price rise means that the dollars that people hold are worth less. • Falling prices may benefit consumers, however deflation can hurt owners and producers. For example, a drop in housing prices decreases the equity in a person’s home.
How is the price index and inflation is calculated • The government has a number of indexes, but the most common is the Consumer Price Index or CPI • The CPI measures the changes in basic consumer prices over time using an imaginary “market basket.” • The simple equation for calculating the CPI (Price index) is: cost of market basket today/cost of market basket in base year x 100 For example: 120/100 x 100 = 120
Your turn • The cost of a market basket in the current year is 125 • The cost of a market basket in a base year was 100 • Calculate the price index and the rate of inflation • 125/100 x 100 = 125 • 125-100= 25% rate of inflation • What if the current market basket was 150 and the base year was 100 • 150/100 x 100 = 150 price index • 150-100= 50% rate of inflation. • Now make an inflation problem for your partner.
Calculating the Rate of Inflation • Simple: The rate of inflation is the new price index minus 100. For example 125-100= 25 % inflation rate • Proof: (new mkt basket- base mkt basket)/base mkt basket x 100 • E.g. (125-100)/100 x 100 = 25/100 x 100 =25%
Anticipated and unanticipated inflation • Anticipated inflation is the rate of inflation that consumers, the government and businesses believe will occur. • Unanticipated inflation causes more problems if prices rise or decline more than people anticipate. • Unanticipated inflation helps debtors who borrow money,but hurts banks and money lenders.
Nominal and real interest rates • The nominal interest rate is the price of borrowing money in today’s dollars. For example, your bank account may pay a nominal rate of 5%. • The real interest rate = nominal rate minus the anticipated rate of inflation. For example if the nominal rate is 5% and the anticipated rate of inflation is 3%, then the real interest rate is 2%.
Other indexes • The Producer Price Index measures the general price changes of producer goods • The GDP deflator is most often used to compare the GDP of different years. The measure takes out price level changes in measuring the total number of goods and services in the economy.
Gross Domestic Product (GDP) • GDP equals the total amount of goods and services produced in an economy over one year. • If GDP goes up then an economy is growing, if GDP goes down then it is shrinking. • GDP is calculated as total consumption + investment + government spending + (exports - imports) or C+I+G+NX=GDP • This is the single most important statistic used by economists to measure economic growth
Consumption component of GDP • Consumption consists of consumer spending on goods and services including: • Durable items such as cars, furniture and appliances • Non-durable goods such as food and clothes • Services
Investment component of GDP • Investment consists of non-residential fixed investment including: • The creation of tools and equipment • The building of new homes or apartments • Inventory changes (stocks of products held by business)
Government component of GDP • Government spending consists of federal, state, and local government spending on goods and services • However, the government component of GDP does not include transfer payments such as social security or unemployment insurance
The Net Export component of GDP • Net Exports is equal to total US exports minus total US imports • Exports are goods and services purchased by people in foreign nations • Imports are foreign goods purchased by US consumers • In years where the value of exports is higher than the value of imports, the GDP number is higher. • In years, such as the last few years, where the value of export is lower than the value of imports, the GDP number is lower.
What’s not counted in GDP • Buying and selling securities (stocks and bonds) • Government transfer payments, like social security • Private transfer payments between individuals (e.g.. Purchasing a used car from a neighbor) • Housework and childcare (if it done outside the market) • Illegal activities
Per Capita GDP • Per capita GDP is the amount of GDP produced in a country per person. • The calculation is GDP/population • Per capita allows economists to compare nations with very different populations and GDP numbers with eachother (e.g. India and Denmark) • Per capita GDP, however, does not tell us about income distribution within a particular society.
Real vsNominal GDP • The nominal GDP is the current GDP in today’s prices. • When economists want to compare GDP for two different years, they need a way take out the price level changes from year to year. This gives them a real GDP measurement. • The tool they use to create constant dollars is the GDP deflator. A base year is chosen for prices and years before or after that year are calculated
Calculation of Deflator • You can derive the deflator if you have the nominal and real GDP’s for a year • GDP deflator = nominalGDP/RealGDP x 100 • E.g. GDP deflator = (110/100) x 100 • Deflator is 110 = 1.1 x 100
Calculation of Real GDP • The calculation of real GDP = nominal GDP/GDP deflator x 100 • For example if GDP = 200 and GDP deflator is 133 then • Real GDP = (200/133) x 100 • 150 real GDP = 1.5 x 100
Expenditure and Income Approaches to GDP calculation • C+I+G+NX calculates the value of goods and services in the product market for a year. • Economists also calculate the total of income accrued to the factors of production. In the Gross Domestic Income (GDI) economists add up wages, profits, and rents. • There is an identity between the two methods, meaning that if calculated properly GDP should equal GDI.
Issues related to GDP • Critics of the GDP argue that a single measure cannot adequately measure the welfare and well being of a country. • Growth may bring negative externalities like pollution, which adversely effects the quality of life of a people. • Economic growth may not be fairly distributed to poorer sectors of society. • Economic growth does not always bring happiness. • Societies with a different mix of market and non-market activities are not easily compared with GDP as measure.
What is economic growth? • Economic growth is defined as increases in per capita real GDP. • Growth can be shown by an increase in the production possibilities curve for a nation. • Economic growth leads to the possibility of increasing the standard of living for a nation’s citizens, however increases in real per capita GDP don’t tell us specifically about income distribution.
What causes economic growth? • Productivity increases in labor - real GDP growth divided by the number of workers (e.g. more output per worker) • Saving is important to growth. If you want more future growth a nation must save today. • Growth and improvements in technology • Research and development and innovation • human capital - education of labor • Open economy (e.g. free market) • Population growth and immigration
Expansions and Contractions • During periods of expansion GDP grows, unemployment falls, and prices tend to rise • During periods of contraction GDP falls, unemployment rises, and prices often fall. • Two quarters of GDP decline is termed a recession. A severe recession is called a Depression.
Puzzling unemployment statistics • Wednesday’s Chronicle said that employment in the service sector expanded in September for the ninth straight month • This morning the TV news said that there was a fall in unemployment claims from 470,000 to 450,000 this month. • Tomorrow the new unemployment percentage will be released. Do you think that these numbers indicate that the unemployment rate will fall, or is it possible that the new rate could increase or stay the same? Explain.
Cost Push and Demand Pull inflation • When resources and factors of production rise in prices this is called cost push inflation. • When increased demand pushes up price levels, this is called demand pull inflation.
Puzzling Prices • Question: Can you explain how the prices of gasoline and food could be going up but the economy is still having deflation? • Answer:The general price level could be falling, despite the fact that some prices are going up. The CPI measures the general level of prices in a market basket. • Question:Do you know what the term is for when prices are going up, but at a slower rate than previously? • Answer: Disinflation