Download
1 / 16
160 likes | 255 Views
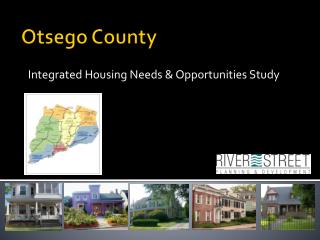
Otsego-Delaware Hops Alliance Initial Report. Carlena Cochi Ficano, Ph.D. and Dawn Rivers, Intern June 26, 2013. Supply. From Where Does Commercial Hops Come?. Sources: EU data (http://ec.europa.eu/agriculture/markets/hops/) and US data (Hops Growers of America 2012 Statistical Report).

E N D
Otsego-Delaware Hops AllianceInitial Report Carlena Cochi Ficano, Ph.D. and Dawn Rivers, Intern June 26, 2013
From Where Does Commercial Hops Come? Sources: EU data (http://ec.europa.eu/agriculture/markets/hops/) and US data (Hops Growers of America 2012 Statistical Report)
Current NY Supply • 2% of 2013 state acreage in Otsego County
2013 NY Hops by the Numbers • 101,552 hills on ~100 acres statewide • (<0.1% of US production) • Acreage concentrated • Finger Lakes region • Western Madison eastern Onondaga counties • 4 locations in Otsego County
A Potential for More – Idle Acreage • Otsego County • 7,498 acres of idle farm land • 185 farms (40 acre average) • Delaware county • 1,909 idle acres • 94 farms (20 acre average)
Current NY Demand • Otsego County home to a few large brewers Source: NYSBA, 2013
Local Demand by the Numbers • Approximately 100 NY craft breweries • Appear to drive hops production • Otsego county is home to four of these • Brewery Ommegang • Butternuts • Cooperstown Brewing Company • Council Rock Brewery • Matts brewery in neighboring Oneida County is 8th largest craft brewer in the nation • Rough estimate of annual production 210,000 barrels for Matts
How Much Hops is Needed? • Rough estimates* of existing local demand (100% conversion to local aromatic hops purchase) • 80,000 – 100,000 lbs. supported on ~90 acres BUT… • 100% conversion unlikely** SO... • Need additional local beer production * Based on 2010 VT feasibility study (Wilson 2010). Current NY survey in progress. ** Based upon phone conversation with state hops expert.
Existing Incentives for Entry of New Breweries • Growing craft beer industry* • 2012: 15% growth by volume and 17% by dollars • 2011: 13% growth by volume and 15% by dollars. • New York State Farm Brewery Law • Allows for on and off-site sales at reduced cost • Requirement: ingredients grown in NY (not necessarily on brewery site) • 20% until the end of 2018 • 60% until the end of 2023 • 90% after January 1, 2024 Source: Brewers Association data (http://www.brewersassociation.org/pages/business-tools/craft-brewing-statistics/facts)
Rough Proposal–- 2 Prong Approach • Pilot 6 farm cooperative to scale from 6 to 30 acres over 5 years • Initial (rough) estimates of 5.7% annual ROI over 12 years at $15/lb. price point and 1,000 lb/acre yield • Plan can be replicated on additional farmer groups • Farmers can scale to 10 acres at end of pilot • Encourage brewery(s) to locate in Otsego County • Purchase local hops • Access railway
Barriers to Local Hops Production • Farmers -- Producers • Start-up capital • Cash flow • Access to processing infrastructure • Risk aversion / independence • Brewers – Consumers* • Volume? • Consistent quality? *Based on VT feasibility study (Wilson, 2010). NY survey in process.