Download
1 / 1
10 likes | 135 Views
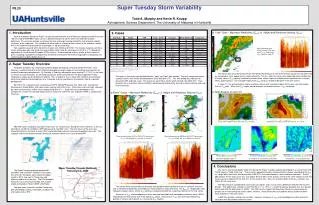
Super Tuesday Storm Variability Todd A. Murphy and Kevin R. Knupp Atmospheric Science Department, The University of Alabama in Huntsville. P8.20. 1. Introduction. 3. Cases. b) “Late” Case – Maximum Reflectivity (Z max ) vs. Height and Rotational Velocity (V ROT ).

E N D
Super Tuesday Storm Variability Todd A. Murphy and Kevin R. Knupp Atmospheric Science Department, The University of Alabama in Huntsville P8.20 1. Introduction 3. Cases b) “Late” Case – Maximum Reflectivity (Zmax) vs. Height and Rotational Velocity (VROT) • Several supercells during the Super Tuesday tornado outbreak of 5-6 February 2008 passed within at least 130 km range of WSR-88D radars so that a detailed analysis of storms within the outbreak could be performed. This analysis includes examining the time and height varying reflectivity and rotational velocity structures of the supercells. The variability of these fields in relation to other storms in the outbreak, relative time in the outbreak and occurrence of tornadoes is closely examined. • Two supercells passed within 30-40 km of radar sites KNQA and KOHX. The relative steadiness of these storms during passage, along with the large motion vector (from the southwest at 20-25 m s-1), allowed the application of a synthetic dual-Doppler (SDD) analysis. A more detailed analysis of one of these storms is given, including a complete thermodynamic retrieval that evaluates the relative magnitudes of buoyancy and vertical gradient of perturbation pressure. Base reflectivity from KOHX at 0651 UTC (left) and Zmax vs. Height and VROT (right) for storm C1 C1 2. Super Tuesday Overview • Favorable conditions for a significant outbreak began developing a few days before the event. By 3 February, southerly flow off the Gulf of Mexico provided an ample supply of heat and low-level moisture for severe thunderstorm development. By Tuesday, 5 February, dew points were nearing 21 C (70 F) as far north as Tennessee and Kentucky. An elevated mixed layer which advected over the Mississippi River Valley reinforced a large area of conditional instability. This unstable air mass, along with sufficient environmental wind shear aided by the development of a strong low-level jet, provided an environment ripe for supercell development. • By 2100 UTC, a broad area of surface based CAPE (SBCAPE) greater than 1000 J kg-1 covered the Southeastern United States, with some areas nearing 1500-2000 J kg-1. Wind shear was also high, indicated by storm-relative helicity (SRH) values approaching 300 m2 s-2. Supercells easily developed in this environment, and the first tornado report came at 2132 UTC, within the axis of greatest SRH in southeastern Arkansas. 1 Time period when storm was at a maximum of 130 km from radar site 2 Maximum tornado rating during time period (during life of storm) 3 Performed by Johnson (2009) • The storms that occurred during the late time period traveled just in front of the primary squall line and often had an elongated or linear appearance in radar reflectivity. The Zmax plots for these cases appeared more variable than the early storms; Zmax typically exhibited a pulsed nature, where single or multiple pulses would elevate its height (likely updraft pulses). The average height of the Zmax contours tended to be lower in the later storms. • In storm C1, this pulsed pattern had an oscillatory nature with a period of about 32 minutes (see thick yellow lines in Zmax plot). When the Zmax heights would decrease (in between pulses), VROT increased. • The cases in this study were divided between “early” and “late” time periods. The early cases were those supercell storms that initially formed between 2100 and 0300 UTC. This time period was indicative of elevated CAPE and high shear. The late cases were those storms which formed after 0300 UTC. They formed in an environment where instability had decreased substantially, but shear continued to be high and even increased. • “Early” Cases – Maximum Reflectivity (Zmax) vs. Height and Rotational Velocity (VROT) • c) SDD Analysis of storm C1 A1 B2 Z and storm-relative flow of storm C2 at 1.5 km AGL Vertical cross section of storm C1 taken at X = -21 km • SBCAPE values tended to stay above 1000 J kg-1 for several hours during the event, however, as the sun went down, so did the instability; CAPE decreased to near 500 J kg-1. The later hours of the event was characterized by its increase in shear; SRH stayed elevated and even increased throughout the event. The supercell storms that moved through Tennessee tended to follow an axis of elevated SRH. Base reflectivity from KNQA at 2332 UTC (above) and Zmax vs. Height and VROT (below) for storm B2 Base reflectivity from KLZK at 2319 UTC (above) and Zmax vs. Height and VROT (below) for storm A1 Vertical Motion at 3.0 km AGL Maximum updraft of 35 m s-1 Pressure Perturbation at 3.0 km AGL p’ minimum of -3.0 mb near updraft max Total Buoyancy Deviation at 3.0 km AGL B maximum 2-3° near updraft max 4. Conclusions • The storms that formed before 0300 UTC during the Super Tuesday outbreak developed in an environment with CAPE values of 1000-1500 J kg-1. These storms appeared steadier and persistently stronger according to the Zmax vs. Height plots than those that formed after 0300 UTC; those developed in a more stable environment. The 50 dBZ contour for the early cases was at or above 8 km for 65% of the analysis time but the same contour for the late cases was at or above 8 km for only 27% of the analysis time. Also, the average height of the Zmax contours was higher for the early cases. • The SDD analyses completed for storms B2 (not shown) and C1 also show a difference between the two time periods. The updraft was stronger in storm B2 (50 m s-1 vs. 35 m s-1) and the buoyancy deviation was 3-4° greater (consistent with the differences in CAPE). The SDD results suggest that buoyancy forcing may have played a greater role in maintaining the earlier storms, whereas, shear driven pressure gradient forces could have been more important in the later storms. • In both time periods, rotation was variable. However, increases in VROT and tornadogenesis often occurred coincident with descending reflectivity cores. • The Super Tuesday outbreak produced 87 tornadoes and caused 57 fatalities in four states. Five of the 87 tornadoes were violent tornadoes (rated as EF4), two each in Tennessee and Alabama and one in Arkansas. The EF4 tornado in Arkansas was a long track tornado, with its path length estimated at 196 km (NWS Little Rock). • Two long track supercells affected Tennessee, both developed numerous tornadoes and both had a tornado rated as EF4. • The storms which occurred during the early time period tended to exhibit the classic supercell structure, with a well defined hook echo and expansive forward flank in radar reflectivity. The Zmax vs. Height plots often indicated steadier storms, where Zmax contours remained elevated for a significant portion of the time series. • Increases in VROT and tornadogenesis often occurred coincident with descending reflectivity cores (DRCs, indicated by the thick yellow line in the above Zmax plots). Decreases in VROT was often occurred during periods of vertical storm growth (i.e. increasing Zmax heights).