Download

1 / 21
210 likes | 237 Views
This research paper explains the methodology and analysis used to produce household estimates from various administrative data sources. It discusses the challenges faced and the strategies employed to improve accuracy and reliability.

E N D
Producing household estimates from administrative data Methodology and analysis towards ONS Research Outputs 2016
Definitions A household is defined as: one person living alone, or a group of people (not necessarily related) living at the same address who share cooking facilities and share a living room or sitting room or dining area.
Aims • Produce household statistics as part of Research Outputs 2016. • Three types of statistics over the next few years:- • Number of households • Household size • Household composition • Priority for 2016 is household numbers • Derived from the same base as population estimates (SPD) • Replicate a similar output package as the population estimates - time series • Can be produced at various levels of geography • Updated in line with newer SPDs.
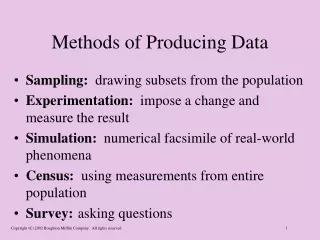
What data can we use? AddressBase Population Coverage Survey Tax and Benefits data
Comparing with other ONS outputs OA Output Area DAU Demographics Analysis Unit LFS Labour Force Survey SPD Statistical Population Database No mid year estimates as with population • Can evaluate quality in 2011 by comparing with Census estimates, down to OA level. • DAU produce national estimates for 1996 onwards: • Families and people in families • Households and people in households Produced from LFS – sample size - 41,000 households containing around 100,000 individuals. Internally estimates can be produced at Local Authority level.
Can AddressBase help? There are 1128 classifications of address on Address Base, an Ordinance Survey product, including care home, house boat and caravan. Classifications have four levels of detail (many/most do not) and have dates attached, that allows further validation.
Address Matching OSAPR Ordnance Survey Address-Point Reference Number UPRN Unique Property Reference Number • Address matching methodology is developing at ONS - estimate a 5% increase in match rate. • Need a reliable unique identifier for addresses - transition from OSAPR to UPRN
Changes in address identification OSAPR Ordnance Survey Address-Point Reference Number UPRN Unique Property Reference Number Currently ONS has attached OSAPRs onto records up to 2013, with a switch to UPRNs in 2014. We would expect an increase due to housing stock growth of around 1%. 77% of LAs show an increase of more than 1 %.
Challenges Our three biggest challenges for producing household numbers Definition – household/address is not a one to one relationship. Half weights on SPD – when sources disagree e.g. Correct address allocation • data lags • high churn • people not deregistering • poor AddressBase matching/allocation
Dealing with half sizes • Our objective is to count each person in a household – need to resolve unmatched records Two methods Redistribute according to household size distributions Source preferenceHESA èPR èCIS (based on most likely address identifier depending on demographic group/ dates on data)
Dealing with half sizes Over counting large household sizes, whilst undercounting 1 and 2 person households. It is anticipated that better address matching and the use of UPRNs rather than OSAPRs will resolve some of these differences.
Dual System Estimation • ONS often uses DSE to weight up for non response. To trial the use of DSE, to weight up for undercount, I used a 4% sample by postcode taken from the Census as a proxy for a survey. • To allow for differences in samples, 400 samples were taken. • In the future, an annual • survey similar to a • coverage survey could • contribute.
Dual System Estimation For each LA aggregate (Census addresses * SPD addresses)Matched addresses Then to scale up to England and Wales Entire population match Sample population
Dual System Estimation Take 400 random samples of 4% of all postcodes to generate 400 samples of admin data to produce 400 estimations. There 1,305,301 unique postcodes on Census and 1,326,885 on SPD. There are no missing values on either. 400 We can examine each sample to see just how representative it is.
Dual System Estimation Impact of DSE on household counts
Dual System Estimation Influencing factors • SPD match rate has a large influence on estimations • Postcode density – may be higher in London? • Communal establishments – need to be sure that they are not included in SPD numbers It is hoped that a large number of unmatched addresses will be resolved in the near future, reducing the undercount of households seen in the SPD.
Allocating address at SPD record level Using many data sources to find our ‘best’ address. Benefits Enables aggregation at different levels and cross tabulation with other variables. Can weight certain data sources for different demographic groups . e.g. students Note: a non valid UPRN may occur when the address given cannot be matched to one on reference data, or is not in England and Wales
Allocating address at record level PR Joe Bloggs 17/4/1974 UPRN: 12345 CIS Joe Bloggs 17/4/1974 UPRN: 12346 Can use activity data to locate the newest address. True match on SPD Patient register moves - PDS Joe Bloggs 17/4/1974 move 1 - 1/1/2011: UPRN: 12345 Joe Bloggs 17/4/1974 move 2 - 2/2/2011: UPRN: 22345 Joe Bloggs 17/4/1974 move 3 - 3/3/2013: UPRN: 12346
Using all addresses from datasources If we consider any address found on any data source to be a live address, we could use a count as an estimate of all live addresses. Cons: Loss of coherence with the population base – usual residency. Pros: Includes all live addresses. Further refinement of addresses by address type can be applied. e.g. removal of communal establishments. * 2011 - Census Outputs, 2013 and 2014 - Demographics Analysis Unit
Household Composition Initial investigative method using age, sex and hashed name similarity. Other data sources containing family relationships are being investigated e.g. tax and benefits data.
Plans for the future • This year – numbers of households by LA, England and Wales, 2011 for • Research Outputs, Autumn 2016 • Future releases • Household sizes • Household composition • Case studies of Local Authorities of interest We have initiated a ONS household working group to join different sectors of work e.g. Address register, commercial data - aerial photography, house price index, existing surveys. Investigating production of an enhanced address register.