Evaluating Aid for Trade: Monitoring Flows and Performance Indicators (2006 Review)
170 likes | 274 Views
This document outlines the WTO Expert Symposium on Evaluation and Monitoring of Aid for Trade (AfT) flows. It emphasizes the importance of tracking AfT, exploring why and how to monitor these funds, with a focus on 2006 data. The report includes insights into global flows, regional and sector distribution, main recipients and donors, and highlights trends such as a 10% increase in commitments. The analysis integrates quantitative and qualitative assessment methods, aiming to enhance the effectiveness of aid in promoting economic growth and development across various sectors.

Evaluating Aid for Trade: Monitoring Flows and Performance Indicators (2006 Review)
E N D
Presentation Transcript
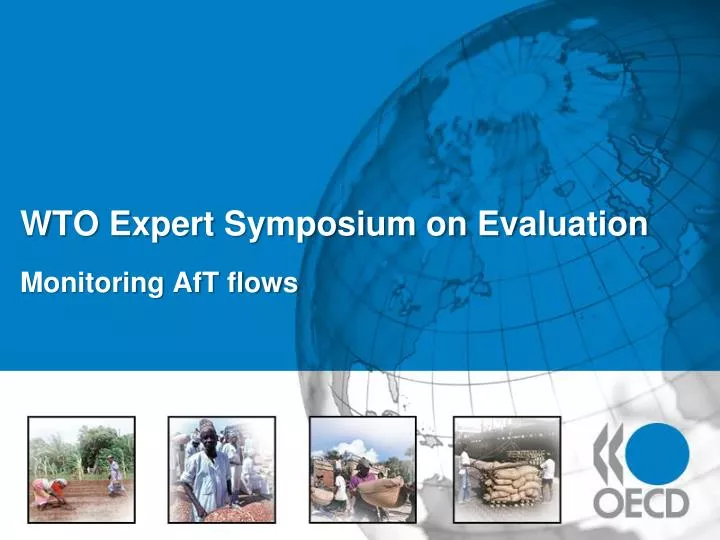
WTO Expert Symposium on Evaluation Monitoring AfT flows
Outline • Why monitor aid for trade? • How to monitor aid for trade? • Aid for trade flows in 2006 • Global flows • Sector distribution • Regional distribution • Main recipients • Main donors • Additionality • Conclusions
How to Monitor? PerformanceIndicators QuantitativeInformation Tracking Aidfor Trade flows WTO Global Review of Aid for Trade Donorself-assessments QualitativeInformation In-countryself-assessments TPRM: more in-depth assessments
Tracking Global Flows Using theCreditor Reporting System (CRS) CRS Economic Growth Other Social Development • Trade Policy & Regulations • Productive Capacity • Infrastructure • Trade Related Structural Adjustment • Education • Health • Governance • Debt • Multi Sector • Emerging Aid • Administrative Costs Other Trade-Related Needs DAC Donors Recipient Global Amounte.g. € 23 bn. Donor Amounte.g. € 2 bn. Recipient Amounte.g. € 0.5 mn. WTO Annual Aid for Trade Review
Aid for Trade Commitments In 2006: • 10% increase, or • $2.2 bn (USD billion, 2005 constant)
Sector Distribution In 2006: • Infra + $1 bn • PCB + $0.8 bn • TPR + $0.4 bn 4.4% 3.1 % 42.7% 42.2% 52.4% 53.4% (USD billion, 2005 constant) Infrastructure Productive Capacity Building Trade Policy & Regulations
Regional Distribution $10.4 bn $1.2 bn $7.5 bn $1.8 bn $0.2 bn 2002-05 Ave. 2006
Regional and Sector Distribution AFRICA AMERICA ASIA EUROPE OCEANIA GLOBAL Infrastructure Productive Capacity Building Trade Policy & Regulations
Regional Programmes GLOBAL (6.6%) REGIONAL (10%) COUNTRIES (84%) 2002-2005 Average
Regional Programmes GLOBAL REGIONAL COUNTRIES • Increased to: • USD 4.2 billion • 18.5% share of total Aid for Trade • Global programmes remained constant 2006
Income Groups 8 7 6 5 4 3 2 1 0 LDCs OLICs LMICs UMICs 2002-05 Ave. 2006 LDCs OLICs GNI < $825 per capita LMICs $825 < GNI < 3255 LIMICs $3256 GNI < 10.065
Donors 5.0 4.5 4.0 3.5 3.0 2.5 2.0 1.5 1.0 .5 0 2002-05 Ave. 2006
Conclusions • Increased 10% • Regional programmes doubled • Additionality: positive outlook Aid for Trade in 2006