Download
1 / 63
630 likes | 722 Views
Using ReportWorks. Dori Baldwin Student Info Mgmt Coordinator Kent ISD. Agenda. Welcome & Introductions Objectives Introduction to ReportWorks Create Labels Create Student Schedules Create Cross Tab Reports Create Form Letters. Objectives .

E N D
Using ReportWorks Dori Baldwin Student Info Mgmt Coordinator Kent ISD
Agenda • Welcome & Introductions • Objectives • Introduction to ReportWorks • Create Labels • Create Student Schedules • Create Cross Tab Reports • Create Form Letters
Objectives Upon completion of today's training you will be able to: • Explore an existing report • Setup mailing labels with a logo • Create a list of student’s demographic information • Create a Cross Tab Report • Write form letters
Meet the Trainers • Been with the ISD 11 years • Started in the classroom • On PowerSchool since 2001 • Certified PowerSchool Trainer Dori
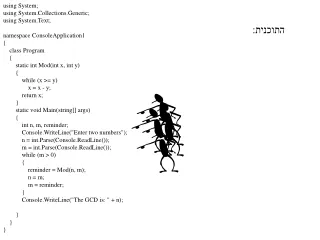
Main features • Drag-and-drop interface – no more writing codes • Create report templates for other PowerSchool users to run without knowing SQL
Tools • The pages • The Inspector and thepanels
Details Tab • Title of the report • Information about the report • Publish State • Choose Data Set • Student : Basic • Student : Basic + Schedule • New ones with 1.1
Scope Tab • Boundaries (filters) • Runtime Controls • Data Sets
Layout Tab • Drag and drop data objects (fields) • Preview Report
Publish Tab • Make the report available to other PowerSchool administrative users • Choose the format your users will see • Choose where the report will show in PowerSchool
The Inspector • Changes with the level • Document • Page • Label • Text
The Panels • Used in conjunction with the inspector • Modifies format • Color • Font • Format
2 Ways to Get There • Start from the PowerSchool Main Menu • Click ReportWorks • Click Reports Setup ReportWorks
Separate Application • JavaTM application
Template or From Scratch • Template • Provide frame work • Good starting place • Can be used as a starting point for staff • Scratch • Blank slate
Let’s go live . . . Activity 1 - Creating a Student Schedule from a Template
Labels are a snap with ReportWorks • Sizes are already defined • Easier to add your own logo • Preview the labels before printing or saving
By the numbers Give your report a title Limit the data by setting Boundaries (Filters) Create the Initial Layout Choose the Label Type Arrange the data
Start and Name the Project • From the PowerSchool main menu • Click ReportWorks • Launch • Select Project from scratch • Enter name and discription • From the Detail • Select the Student :Basic Data set
Setting Boundaries • Boundaries limit or filter who the report will be run for • Use Data Set at the bottom to drag field into the boundaries area • Add the desired filter • Repeat as necessary
Create the Initial Layout • In the Layout tab • Drag “Student” from the data set to the layout area • Select the labels report type
Choose the Label Type • Open the Labels inspector • Under Avery Product number select 5160: Address Labels
Arrange the Data • Double-click in the 1st label (upper left) • Drag Students > Contact > FirstLast Name into this label • In the Inspector, enter the LF or other text • Continue to drag fields into the label
Let’s go live . . . Activity 2 – Create Mailing Labels Activity 3 – Add a Logo to your Labels
Basic Student List • Use a table to layout the fields • Drag the fields into the individual cells • Re-size the table to cover the entire page
By the numbers Start a new project Choose Table Arrange the fields in the table Click Standard > Add Alternate Use the Inspector to change the row color
Start a New Project • Click “+ add” button and select to Add Project • Created as Untitled Project • Right click and Load • Click Details tab • Enter name and description • Select the Student :Basic Data set
Choose Layout Type • In the Layout tab • Drag “Student” from the data set to the layout area • Select the Table report type
Arrange Fields • Drag Students > Contact > Last Name into the 1st column • Continue to drag fields into the columns • First name • Ethnicity • Gender • Adjust column widths
Select Alternate Rows
Select Row Colors • Click Student Details • Red box should be around all columns • In the Table Row Inspector • Click the paint can to open the Paint/Fill Inspector • Select the desired color
Let’s go live . . . Activities 4 – 7 Create and format a Simple Student List
Making Information out of Data • Similar to Pivot Tables • Counting the numbers of boys vs girls • Identify which class has the most diverse population • How many seniors are girls
Let’s go live . . . Activities 8-9 Create and format a Cross Tab Report
Label Layout Help • Open Microsoft Word • Under Mailings – Labels • When you pick a specific label you can view the details
Now It’s Your Turn . . . Complete Activity 4 – Create a Mailing Label
Object Reports Create when your report requires: • Complete Control of Layout • Graphics • Multiple Pages per student • Multiple Students per page
Basic Report Elements Text and words