Image Analysis and Performance Metrics Working Group
10 likes | 103 Views
Image Analysis and Performance Metrics Working Group DCE-/DW-MRI subgroup; chair and co-chair: Michael Jacobs and David Newitt. 2013-14 Milestone Chart. Platform-Dependent Image Scaling Challenge

Image Analysis and Performance Metrics Working Group
E N D
Presentation Transcript
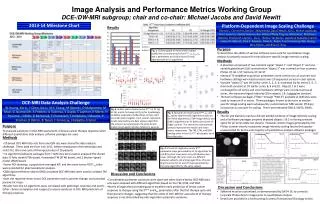
Image Analysis and Performance Metrics Working Group DCE-/DW-MRI subgroup; chair and co-chair: Michael Jacobs and David Newitt 2013-14 Milestone Chart Platform-Dependent Image Scaling Challenge Thomas L. Chenevert, Dariya I. Malyarenko, David Newitt, Xin Li, Mohan Jayatilake, Alina Tudorica, Andriy Fedorov, Ron Kikinis,Tiffany Ting Liu, Mark Muzi, Matthew J. Oborski, Charles M. Laymon, Xia Li, Thomas Yankeelov, Jayashree Kalpathy-Cramer, James M. Mountz, Paul E. Kinahan, Daniel L. Rubin, Fiona Fennessy, Wei Huang, Nola Hylton, and Brian D. Ross Results • Purpose • To determine the ability of various software tools used for quantitative image analysis to properly account for manufacture-specific image intensity scaling. • Methods • A phantom comprised of two constant signal “object 1” and “object 2” and one variable gadolinium (Gd) concentration “object 3” was scanned on four scanners: Philips 3T; GE 1.5T; Siemens 3T; GE 3T. • Identical T1-weighted acquisition parameters were used across all scanners and hardware settings were held constant over 10 sequential series on each system. • Variable “object 3” was 0% Gd for series 1, 2, 3, 4; increased Gd for series 5, 6, 7; then held constant at 2% Gd for series 8, 9 and 10. Objects 1 & 2 were unchanged for all series and since hardware settings were constant across all series, the measured signal intensity (SI) in objects 1 & 2 should be constant. • Thirteen software packages (“SW1” through “SW13”) available at QIN sites were used to measure SI vs series. Three packages, known to be naive to vendor-specific image scaling were subsequently customized per MRI vendor (Philips) instructions to account for scaling. These were denoted SW14, SW15, SW16. • Results • The GE and Siemens scanners did not exhibit evidence of image intensity scaling and all software packages properly depicted objects 1 & 2 as having constant signal for all series (data not shown). However, dicom images generated by the Philips scanner clearly incorporate image intensity scaling facotrs that appear unaccounted for by the vast majority of quantitative analysis software packages. • Discussion and Conclusions • Software must be customized, as demonstrated by SW14-16, to correctly (un)scale Philips dicom images prior to quantitative analysis. • Details are provided in a forthcoming (in press) Translational Oncology article. Fig. 1. Column graph of mean within-subject coefficient of variation (wCV) for Ktrans, ve, kep, vp, and τi parameters at V1 (blue) and V2 (red) obtained with all 12 algorithms. DCE-MRI Data Analysis Challenge W Huang, Xin Li, Y Chen, Xia Li, M-C Chang, M Oborski, D Malyarenko, M Muzi, G Jajamovich, A Fedorov, A Tudorica, S Gupta, C Laymon, K Marro, H Dyvorne, J Miller, D Barboriak, T Chenevert, T Yankeelov, J Mountz, P Kinahan, R Kikinis, B Taouli, F Fennessy, J Kalpathy-Cramer Fig. 3. Scatter plots of mean tumor Ktrans at V1 (a), V2 (b), and its % change (V21) (c) for 3 pathologic complete responders (pCRs) (black circles) and 7 non-pCRs (red triangles). Each column represents results returned by one data analysis algorithm. The columns associated with the same kinetic model are grouped together (labeled in panel a). Fig. 2. Box plots of mean tumor Ktrans, ve, and kep values obtained with algorithms based on the TM (6 algorithms), ETM (4 algorithms), and SSM (2 algorithms) at V1 (left column) and V2 (right column). The central bar and diamond symbols represent the median and mean values, respectively. The TM, ETM, and SSM labeling order in the V1 Ktrans plot applies to all the other plots. Purpose To evaluate variations in DCE-MRI assessment of breast cancer therapy response when different quantitative data analysis software packages are used. Methods • 20 breast DCE-MRI data sets from one QIN site were shared for data analysis challenge. These data are from visit 1 (V1, before neoadjuvant chemotherapy) and visit2 (V2, after one cycle of therapy) studies of 10 patients. • 12 algorithms/software packages from 7 QIN sites were used to analyzed the shared data: 6 Tofts model (TM) based, 4 extended TM (ETM) based, and 2 Shutter-Speed model (SSM) based. • Tumor ROI drawings, a population-averaged AIF, and the mean tumor ROI T10 value were provided for pharmacokinetic analysis. • QIBA digital reference object (DRO) simulated DCE-MRI data were used to validate TM algorithms. • Each site reported mean tumor DCE parameter and its percent change, and provided parametric maps. • Results from the 12 algorithms were correlated with pathologic response end points (after chemo completion and surgery) to assess variations in DCE-MRI prediction of therapy response. Fig. 4. V1 and V2 single slice tumor Ktrans parametric maps generated by all 12 algorithms for a pCR (top two rows) and a non-pCR (bottom two rows). Although the color scales are different between subjects and among algorithms, they are kept the same for V1 and V2 maps generated by the same algorithm for the same subject. Discussion and Conclusions • Considerable parameter variations were observed when shared breast DCE-MRI data sets were analyzed with different algorithms based on the TM, ETM, and SSM. • Nearly all algorithms provided good to excellent early prediction of breast cancer response to therapy using the Ktrans and kep parameters after the first therapy cycle and their percent changes, suggesting that the utility of DCE-MRI for assessment of therapy response is not diminished by inter-algorithm systematic variations.