Trends in Inequality
Trends in Inequality. Lecture 2 September 10, 2012. Changes in the U.S. . Since the 1970s Income inequality has grown a great deal The labor market has restructured with a hollowing out of jobs in the middle. (David Autor, MIT Economics)

Trends in Inequality
E N D
Presentation Transcript
Trends in Inequality Lecture 2 September 10, 2012
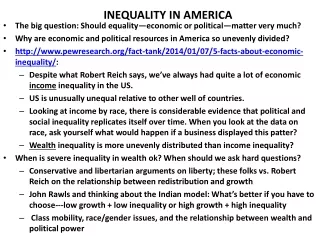
Changes in the U.S. Since the 1970s • Income inequality has grown a great deal • The labor market has restructured with a hollowing out of jobs in the middle. (David Autor, MIT Economics) • Incarceration has grown to unprecedented levels (Bruce Western, Harvard Sociology) • US has become more diverse in terms of race and ethnicity and immigrant generation. • Families have become more diverse with more forms of family life. Men and women have had different economic trajectories. (Bianchi, UCLA Sociology)
World War II to 1973 • Rising tide lifts all boats Family incomes doubled in the two decades after World War II. • Expanded social security/health benefits • War on poverty. All time low in 1973. • Poverty rate cut in half between late 1940’s and early 1960’s • Cut in half again by the early 1970’s.
1973-1982 • Quiet depression. Median income fell. Poverty rose. • Oil price shock. Gas lines. Inflation high. 1973-1979 CPI rose 100% • People delayed marriage, reduced fertility, married women entered LF.
1982-1989 Reagan Recovery • Income per capita rose, but inequality rose steeply. • Average real wage of male HS dropouts FELL by 18% • Male high school graduates wages FELL by 13% • Men with college held steady
1980’s Decade of the MBA • Winners: women at all levels, men with advanced degrees. • Downsizing, mergers, takeovers. • Outsourcing of production to foreign countries • Declining demand for unskilled workers.
1980’s • Change in value of college degree relative to high school degree • Among men age 25-34 • In 1979 those with college degree earned 20% more • In 1989 those with college degree earned 47% more • Rise in single female households, and in yuppies, and DINKs.
1989-1993 • White Collar Recession, decline in average family income • Median family income fell every year from 1989-1993. • Inequality continues to rise. Top 20% increasing. Bottom 80% decreasing. • 1993 Poverty rate was 15.1%
1993-1999 • Expansion of the economy. Rich grow a lot richer. Middle grows moderately. Poor stay stagnant, or rise a small bit. • Professionals and managers saw their incomes increase, but also reported longer hours. Best paid and most educated workers saw increases in hours worked. Their benefits, especially pensions rose.
1999-2002 • Recession. Unemployment rises. • Median Household Income Declined 3.4%
2002-2007 • Rich got richer through tax cuts and income growth • The rest of the distribution saw stagnation or decline
Which Statistics to Use? • Household vs. Family Income • Census defines a family as a group of two or more persons related by birth, marriage or adoption and residing together. • Families have higher incomes. Households have greater inequality in income because of the variety of types of households. Rise in non family households. Elderly and people living alone or with non relatives.
Which Statistics to Use? • Wage Data or Benefits • For those who get benefits, they have become a greater part of their overall compensation package. • The fraction of working men who get benefits has been falling.
Which Statistics to Use? • Mean or Median? • Who earns more, graduates of Harvard College or those who drop out without a degree? • Pre Tax or Post Tax Income? • Post tax income is more equal. • Starting Dates Matter. 1973 or 1968?
Census or Administrative Records • Top earners are top coded. • IRS data provides better information on the top of the income distribution. • SEC data on the incomes of the top five executives in public companies provides information on executive pay.
2010 Income Data Median Household Income $49,445 Family Household Income $61,544 • Married Couple Family $72,751 • Female Head, no Male $32,031 • Male Head, no Female $49,718 • Non Family Female HH $25,456 • Non Family Male HH $35,627
Bank Executives • Rule to cap corporate salaries for companies that take taxpayer dollars to $500,000 per year. • “Five hundred thousand dollars is not a lot of money” said the compensation expert, James F. Reda, “particularly if there is no bonus”.
New York Times Sunday StyleFebruary 8, 2009 • “You Try to Live on 500K In This Town” • Married with two children • Taxes=269,000 a year • Two vacations a year, a winter trip to the sun and a spring trip to the ski slopes $16,000 • A modest 3 bedroom apartment purchased for 1.5 million Cost $192,000 a year • Mortagage $8,000 a month • Co-op Maintenance Fee $8,000 a month
Costs for Rich People in NY • Summer House in Southampton that cost 4 million, carries mortgage payments of $240,000 • Car and chauffer • Chauffer costs 75K to 125K • Garage for car $700 per month • Personal Trainer $80 an hour, 3 times a week, is $12,000 a year.
Costs of being Rich • Three gowns a year for charity balls $35,000 a year. • Two children in private school $64,000 • Nanny $45,000 • Private tutoring for SAT at 250 an hour, is $3,750 • Groceries 425 every 10 days or 15,000 dollars
Costs of being Rich • Not counted: • Restaurants, clothing, dry cleaning, spas and other grooming for family and pets, donations to charity • Total Costs: 790, 750 which would require an income of 1.6 million to compensate for taxes.
Changing Labor Market • Hollowing out of jobs in the middle. • Women overall doing better over time. • Men overall doing worse over time. • Premium on education, higher educated doing better.
Winners and Losers • More educated men and women are winners. • Less educated women gained some. • Less educated men lost ground. • Families with two earners made up the difference. • Elderly did well, children fared poorly.
Source: David Autor,The Polarization of Job Opportunities Center for American Progress, August 2010
Source: David Autor,The Polarization of Job Opportunities Center for American Progress, August 2010
Source: David Autor,The Polarization of Job Opportunities Center for American Progress, August 2010
Defining Poverty • What are the different ways we could define poverty?
Defining Poverty • What are the different ways we could define poverty? • Relative • Absolute • Subjective
The Government Definition • 1964 Definition. Based on 1955 data. • Families spend 1/3 income on food. Thresholds set at 3 times the cost of the cheapest nutritionally sound food plan for a family of four. • In 1969, the thresholds stay the same, but increases tied to the CPI (Includes goods other than food.)
The Government Definition • 1981. Eliminated the different thresholds for females and males. Eliminated separate farm/non farm thresholds.
2012 Poverty Guidelines for the48 Contiguous States and the District of Columbia
Alternative Definitions • Medical Costs • Costs Associated with Working • After tax, not before tax, income • Include noncash benefits (food stamps, housing subsidies) • Take into account costs of clothing, shelter and utilities. • Geographic variation.