Download

1 / 23
230 likes | 360 Views
Exploring the dynamics of crustal fault system models with micro-scale and CA simulations. Peter Mora, David Place, Dion Weatherley, Steffen Abe & Yucang Wang. Newcastle earthquake. 1.2 0.8 0.4 0.0. Predicted CP. 5 4 3 2 1. LURR value. AMR observations.

E N D
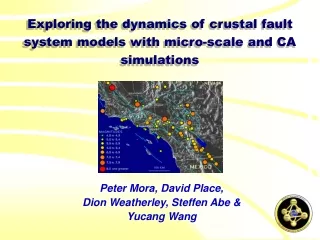
Exploring the dynamics of crustal fault system models with micro-scale and CA simulations Peter Mora, David Place, Dion Weatherley, Steffen Abe & Yucang Wang
Newcastle earthquake 1.2 0.8 0.4 0.0 Predicted CP 5 4 3 2 1 LURR value AMR observations Cumulative Benioff strain release (x 107) Newcastle Earthquake time 1960 1970 1980 1990 1980 1985 1990 To predict or not to predict, that is the question! Observations such as accelerating seismic energy release & high Load-Unload response ratio preceding large earthquakes provide encouragement, understanding of the physics is required. From, Yin, Mora, Peng, Wang and Weatherley, 2002, PAGEOPH, Vol. 159, No. 10
600 400 200 0 AMR critical region radius (km) 0 200 400 600 LURR critical region radius (km) Critical scaling region size Critical region scaling with magnitude suggest a physical mechanism rather than statistical fluctuations are the origin of such observations. 7.8 7.0 6.5 5.7 5.0
No eq cycle = prediction impossible SOC behaviour Eq cycle exists = prediction possible CP behaviour Power law time-to-failure Evolution of statistics
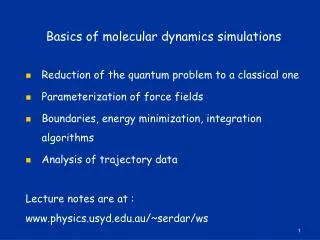
Overview Why use particle and CA simulations. What was learned from particle simulations. What has been learned from CA simulations. What kind of complex system is the crust? Conclusion
Particle simulations Pro: Tractable model of discontinuous systems Con: Computationally expensive Why use particle and CA simulations • CA simulations • Pro: Fast – can explore • overall system dynamics • Con: Simplifications may • affect behaviour
Particle simulations: the lattice solid model Elastic stress transfer, rupture dynamics, granular dynamics, elastic wave radiation, fracture, friction, thermo-mechanical feedback, thermo-porous coupling
Sequence A 2 1 0 Log(N) 3 4 5 6 7 Magnitude Shear experiment of granular layer Cumulative Benioff strain Sequence B Sequence A Time
Load-Unload Response ratio and critical sensitivity LURR = X+/X-
LURR ensemble average 10 1 0.1 LURR Time 10 0 # events Time
What has been learned from particle simulations • See evidence for CP-like behaviour • See evidence for LURR mechanism • Relation between AMR and LURR to be resolved Shows direct evidence for physical mechanism for earthquake forecasting
Accelerating energy release & correlation evolution p = 2.0 p = 0.4
1e+6 10000 100 1 1e+6 10000 100 1 1 0.8 0.6 0.4 0.2 0.0 A A Accelerating ER D N clusters N clusters Smoothness • 100 10000 • N failed cells Dissipation factor D No accelerating energy release • 100 10000 • N failed cells 0 0.2 0.4 0.6 0.8 1 Stress transfer ratio Short range cellular automata
What is learned from CA simulations(See Weatherley, Thurs, 16:45) Can get either CP-like behavior or SOC behaviour depending on: • Dissipation • Stress transfer ratio • Visco-elastic interaction Two regimes: 1. Forecasting possible 2. Forecasting not possible Where is the crust?
Conclusion Elasto-dynamic systems like the crust may lie near the border between predictability and unpredictability
References • Mora, P. and Place, D., 2002, Stress Correlation Function Evolution in Lattice Solid Elasto-dynamic Models of Shear and Fracture Zones and Earthquake Prediction, Pure Appl. Geophys., Vol. 159, No. 10. • Mora, P., Wang, Y.C., Yin, C., Place, D., and Yin, X.C., 2002, Simulation of Load-Unload Response Ratio and Critical Sensitivity in the Lattice Solid Model, Pure Appl. Geophys., Vol. 159, No. 10. • Mora, P., Place, D., Abe, S. & Jaume, S., 2000, Lattice solid simulation of the physics of earthquakes: the model,results and directions, in: GeoComplexity and the Physics of Earthquakes (Geophysical Monograph series; no. 120), eds. Rundle, J.B., Turcotte, D.L. & Klein, W., pp 105-125 (American Geophys. Union, Washington, DC). • Place, D., and Mora, P., Place, D. & Mora, P., 1999, A lattice solid model to simulate the physics of rocks and earthquakes: incorporation of friction, J. Comp. Phys., 150, 1-41 • Weatherley, D., Mora, P., and Xia, M.F., 2002, Long-Range Automaton Models of Earthquakes: Power Law Accelerations, Correlation Evolution, and Mode Switching, Pure Appl. Geophys., Vol. 159, No. 10. • Yin, X.C., Mora, P., Peng, K.Y., Wang, Y.C., and Weatherley, D., 2002, Load-Unload Response Ratio and Accelerating Moment/nergy Release Critical Region Scaling and Earthquake Prediction, Pure Appl. Geophys., Vol. 159, No. 10.