Download
1 / 18
210 likes | 565 Views
Comparing the Early Careers of Michael Jordan, Kobe Bryant, and Lebron James. Introduction. A good estimate of a player’s performance is shown in statistics (points, rebounds, & assists)

E N D
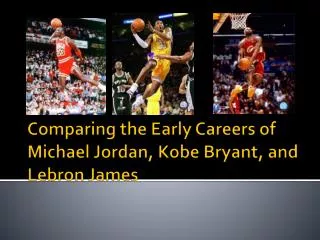
Comparing the Early Careers of Michael Jordan, Kobe Bryant, and Lebron James
Introduction • A good estimate of a player’s performance is shown in statistics (points, rebounds, & assists) • Presuming that Michael Jordan is the best basketball player of the three during his early career, we expected his values to be higher than Kobe Bryant’s or Lebron James’ • We also chose to analyze big game statistics, looking into playoffs performances
Sample Size • We looked at the first five seasons of each player as a full-time starter (Kobe didn’t start his first two seasons) • Michael Jordan’s second season was excluded as he broke his foot and missed most of the season • All statistics were examined game-by-game over the five year period and not season averages
Point Production • Variable N Mean SE Mean StDev Minimum Q1 Median Q3 • Jordan 409 33.271 0.466 9.417 11.000 27.000 33.000 39.000 • Kobe 34625.720 0.481 8.950 0.000 19.000 25.000 31.000 • Lebron 391 27.338 0.444 8.781 3.000 21.000 27.000 33.000 • Variable Maximum • Jordan 69.000 • Kobe 56.000 • Lebron 56.000
Assist Production • Variable N Mean SE Mean StDev Minimum Q1 Median Q3 Maximum • Jordan 409 6.142 0.143 2.882 1.000 4.000 6.000 8.000 17.000 • Kobe 346 5.113 0.146 2.716 0.000 3.000 5.000 7.000 15.000 • Lebron 391 6.578 0.131 2.592 1.000 5.000 6.000 8.000 15.000
Rebound Production • Variable N Mean SE Mean StDev Minimum Q1 Median Q3 Maximum • Jordan 409 6.430 0.155 3.142 0.000 4.000 6.000 8.000 18.000 • Kobe 346 6.023 0.158 2.942 0.000 4.000 6.000 8.000 15.000 • Lebron391 6.890 0.154 3.053 0.000 5.000 7.000 9.000 19.000
Regular Season Conclusions • Jordan clearly scores more points • Lebron leads in rebounds and assists, yet does not dominate the competition like Jordan does in points
Conclusions & Further Considerations • Michael Jordan clearly scores more points • Lebron leads in assists and rebounds during the regular season and playoffs • Overall Jordan’s offensive production still appears to outweigh the other two players • We did not examine any defensive statistics (they were unavailable) • We did not consider strength of team • Jordan played in college, was older and may have been more prepared
References • www.nba.com • www.basketball-reference.com • www.michaeljordansworld.com • Google Image Search