Slide Note
0 likes | 66 Views
FTIR spectroscopy is a widely practiced analytical technique that utilizes the interaction of infrared light with matter. This method offers sensitivity, flexibility, specificity, and robustness in analyzing solid, liquid, and gaseous analytes. The electromagnetic radiation regions, principles of IR spectroscopy, and the differences between IR and FTIR methods are explained. FTIR spectrometers work by Fourier-transforming interferograms to collect data rapidly and accurately for various applications in chemistry, physics, engineering, and more.

E N D
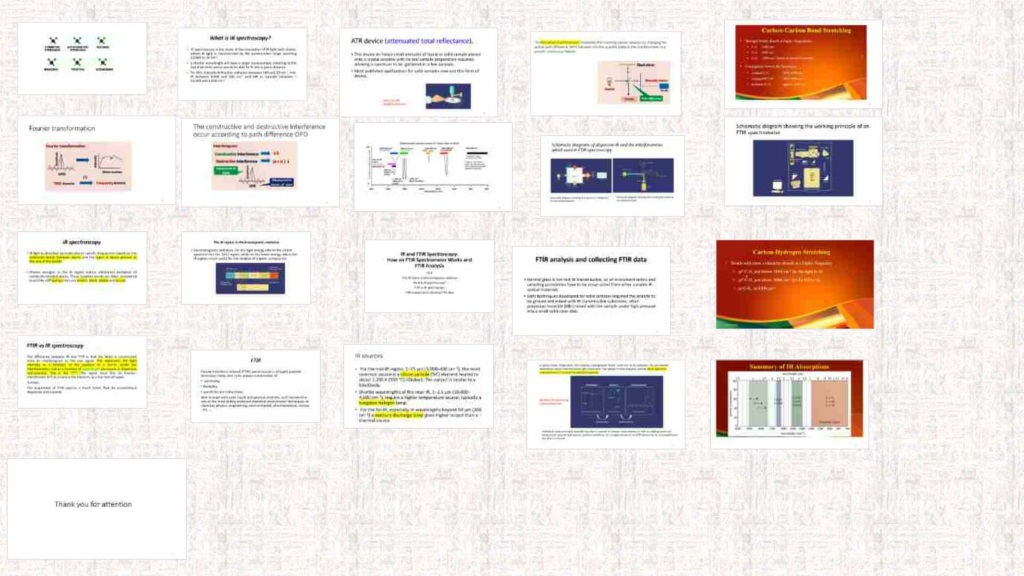
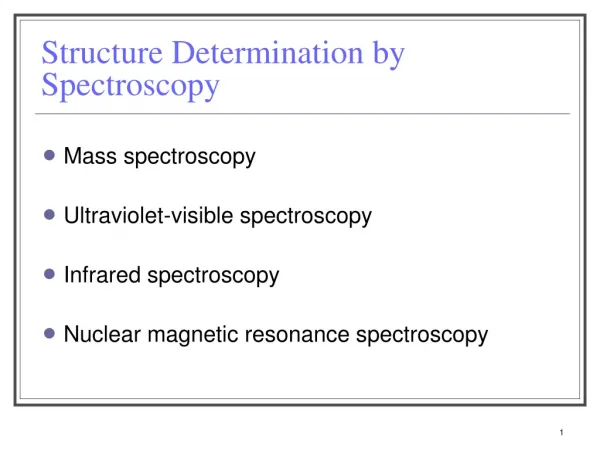
IR and FTIR Spectroscopy: IR and FTIR Spectroscopy: How an FTIR Spectrometer Works How an FTIR Spectrometer Works and and FTIR Analysis FTIR Analysis FTIR The IR region in Electromagnetic radiation What is IR spectroscopy? FTIR vs IR spectroscopy FTIR analysis and collecting FTIR data 2
FTIR Fourier transform infrared (FTIR) spectroscopy is a hugely popular technique today, due to its unique combination of • sensitivity, • flexibility, • specificity and robustness. Able to cope with solid, liquid and gaseous analytes, so it has become one of the most widely practiced analytical instrumental techniques in: chemical, physics, engineering, environmental, pharmaceutical, clinical , etc. …. 3
The IR region in Electromagnetic radiation • Electromagnetic radiation .On the high-energy side of the visible spectrum lies the (UV) region, while on the lower energy side is the IR regions most useful for the analysis of organic compounds. 4
What is IR spectroscopy? • IR spectroscopy is the study of the interaction of IR light with matter, where IR light is characterized by the wavenumber range spanning 12,800 to 10 cm-1. • a shorter wavelength will have a larger wavenumber, referring to the fact that more waves would be able to fit into a given distance. • Far-IR is typically defined as radiation between 500 and 20 cm- 1, mid-IR between 4,000 and 500 cm-1and NIR as typically between ~ 10,000 and 4,000 cm-1. 5
IR spectroscopy • IR light is absorbed by molecules at specific frequencies based on the molecular bonds between atoms and the types of atoms present at the end of the bonds. • Photon energies in the IR region induce vibrational excitation of covalently bonded atoms. These covalent bonds are often considered to act like stiff springs that can stretch, bend, rotate and scissor 6
FTIR vs IR spectroscopy The difference between IR and FTIR is that the latter is constructed from an interferogram as the raw signal. This represents the light intensity as a function of the position of a mirror inside the interferometer, not as a function of wavelength (as occurs in dispersive instruments). This is the “FT“. The signal must first be Fourier-transformed (FT) to produce the intensity as a function of wave number. The acquisition of FTIR spectra is much faster than by conventional dispersive instruments. 8
Schematic diagrams of dispersive IR andtheinterferometer which usedin FTIR spectroscopy Schematic diagram showing the working principle of an interferometer Schematic diagram showing the layout of a dispersive IR spectrophotometer
IR sources • For the mid-IR region, 2−25 μm (5,000–400 cm−1), the most common source is a silicon carbide (SiC) element heated to about 1,200 K (930 °C) (Globar). The output is similar to a blackbody. • Shorter wavelengths of the near-IR, 1−2.5 μm (10,000–4,000 cm−1), require a higher temperature source, typically a tungsten-halogenlamp. • For the far-IR, especially at wavelengths beyond 50 μm (200 cm−1) a mercury discharge lampgives higher output than a thermal source. 10
The Michelson interferometermodulates the incoming optical radiation by changing the optical path difference (OPD) between the two possible paths in the interferometer in a smooth continuous fashion. 11
The constructive and destructive interference occur according to path difference OPD 12
Schematic diagram showing the working principle of an FTIR spectrometer 14
FTIR analysis and collecting FTIR data FTIR analysis and collecting FTIR data • Normal glass is not mid-IR transmissible, so all instrument optics and sampling accessories have to be constructed from other suitable IR optical materials. • Early techniques developed for solid samples required the analyte to be ground and mixed with IR transmissible substrates, often potassium bromide (KBr) mixed with the sample under high pressure into a small solid clear disk. 15
ATR device (attenuated total reflectance). • This device an house small amounts of liquid or solid sample placed onto a crystal window with no real sample preparation required, allowing a spectrum to be gathered in a few seconds. • Most published applications for solid samples now use this form of device. Use of an ATR sampling accessory 16
A typical mode of operation first requires a background “blank” spectrum to be collected. This will contain absorbance values from the entire light beam path. The sample is then analyzed, and the blank spectrum subtracted from it to yield the spectral responses Workflow for producing a typical spectrum Individual scans are rapid, typically less than 1 second on modern instruments, so with co-adding scans and background spectral subtraction, analysis workflows for a single sample on an ATR device can be accomplished in less than 2 minutes. 17
![Fourier transform infrared spectroscopy[FTIR]](https://cdn1.slideserve.com/2743434/fourier-transform-infrared-spectroscopy-ftir-dt.jpg)