Download
1 / 16
160 likes | 316 Views
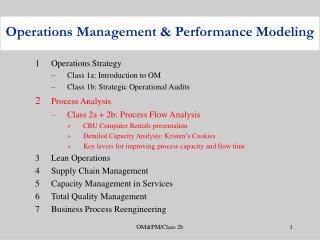
Operations Management & Performance Modeling. 1 Operations Strategy Class 1a: Introduction to OM Class 1b: Strategic Operational Audits 2 Process Analysis Class 2a + 2b: Process Flow Analysis CRU Computer Rentals presentation Detailed Capacity Analysis: Kristen’s Cookies

E N D
Operations Management & Performance Modeling 1 OperationsStrategy • Class 1a: Introduction to OM • Class 1b: Strategic Operational Audits 2 Process Analysis • Class 2a + 2b: Process Flow Analysis • CRU Computer Rentals presentation • Detailed Capacity Analysis: Kristen’s Cookies • Key levers for improving process capacity and flow time 3 Lean Operations • Supply Chain Management • Capacity Management in Services 6 Total Quality Management 7 Business Process Reengineering OM&PM/Class 2b
CRU Computer Rentals: Revenue and Cost Drivers Status 40 Ship Receiving Repairs 30% 70% R Status 24 15% Parts places order Receives from Supplier Customer Ic Pre-Config Status 41 R2 R1 Status 32 Ship Config Repairs Status 20 Status 42 OM&PM/Class 2b
Take Order Wash & Mix Load & Set Timer Bake Spoon You You Roommate, Oven Oven 1 min / doz 2min / doz 9 min/doz 6min / 1-3doz Pay Pack Cool Unload Order Ready Roommate Roommate Roommate --- 1 min / order 2 min /doz 5 min Kristen’s Cookies: Flow Chart OM&PM/Class 2b
Process Architecture is defined and represented by a process flow chart: Process = network of activities performed by resources 1. Process Boundaries: • input • output 2. Flow unit: the unit of analysis 3. Network of Activities & Storage/Buffers • activities with activity times • routes: precedence relationships (solid lines) 4. Resources & Allocation 5. Information Structure & flow (dashed lines) OM&PM/Class 2b
Operational Measure: Flow Time Driver: Activity Times • (Theoretical) Flow Time • Critical Activity • Flow Time efficiency OM&PM/Class 2b
Levers for Reducing Flow Time • Decrease the work content of critical activities • work smarter • work faster • do it right the first time • change product mix • Move work content from critical to non-critical activities • to non-critical path or to ``outer loop’’ • Reduce waiting time. OM&PM/Class 2b
Most time inefficiency comes from waiting:E.g.: Flow Times in White Collar Processes OM&PM/Class 2b
Operational Measure: Capacity Drivers: Resource Loads • (Theoretical) Capacity of a Resource • Bottleneck Resource • (Theoretical) Capacity of the Process • Capacity Utilization of a Resource/Process = throughput [units/hr] capacity [units/hr] OM&PM/Class 2b
A Recipe for Capacity Measurements * assuming system is processing at full capacity OM&PM/Class 2b
Demand Capacity [units/time] Process Capacity Resource x NCX-10 Furnaces Marginal Investment Cost [$/unit/time] Cost Capacity Profile OM&PM/Class 2b
Levers for Increasing Process Capacity • Decrease the work content of bottleneck activities • work smarter • work faster • do it right the first time • change product mix • Move work content from bottlenecks to non-bottlenecks • to non-critical resource or to third party • Increase Net Availability • work longer • increase scale (invest) • increase size of load batches • eliminate availability waste OM&PM/Class 2b
Increasing Process Capacity in The Goal • “is to increase the capacity of only the bottlenecks” • “ensure the bottlenecks’ time is not wasted” • increase availability of bottleneck resources • eliminate non-value added work from bottlenecks • reduce/eliminate setups and changeovers • synchronize flows to & from bottleneck • reduce starvation & blockage • “ the load of the bottlenecks (give it to non-bottlenecks)” • move work from bottlenecks to non-bottlenecks • need resource flexibility • unit capacity and/or #of units. • invest OM&PM/Class 2b
Pricing and Capacity Investment: Trays + Rent another oven at $10/hr? • Resource cost = • Material cost = • Minimum sale price = • Contribution margin if sale price is $5 / dozen = OM&PM/Class 2b
Other factors affecting Process Capacity • Batch (Order) Sizes • Product Mix • other managerial policies ... OM&PM/Class 2b
Chocolate Chip and Peanut Butter Data OM&PM/Class 2b
Class 2b Learning Objectives • CRU: manage better with the three key operational measures and an inter-functional macro process view of the organization • Process measures: • Flow time manage critical activities • Capacity manage bottleneck resources • Levers for improving • Flow time manage critical activities • Capacity & Throughput • Process capacity depends on a zillion things OM&PM/Class 2b