Understanding Invasive Species Prevention Through the Weaker Link Public Good Model
180 likes | 307 Views
This paper explores the concept of invasive species prevention as a public good using the "weaker link" model. It discusses the importance of inter-regional cooperation in prevention efforts, highlighting the cost and efficiency discrepancies in different areas. By analyzing the dynamics of complete versus incomplete information on prevention strategies, the paper reveals that invasive species prevention is often underprovided in equilibrium compared to efficient levels. Recommendations for improving prevention through better communication and cost transparency are also addressed.

Understanding Invasive Species Prevention Through the Weaker Link Public Good Model
E N D
Presentation Transcript
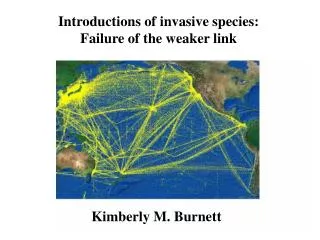
Introductions of invasive species: Failure of the weaker link Kimberly M. Burnett
Prevention of invasions as a public good • Prevention in 1 place is prevention in another • Doing inspections, regulations, monitoring, quarantines, etc. → less likely species will invade → less likely to invade other regions (esp. if shared borders, lots of trade between places) • Examples: • West Nile in HI • Yellow star thistle • Zebra mussels
Prevention of YST AR? MS? 2005 map – http://plants.usda.gov
Prevention of Zebra Mussels GA? FL? 2003 Map – USGS
Special kind of public good • “The exclusion and control of invasive species is a weakest link public good” (Perrings et al. 2002) • Hirshleifer (1983,1985) –introduced weakest link public goods (levy example) • Weakest link implies the following aggregation technology:
Prevention as weaker link • Own prevention helps, even if others do less • Prevention beyond lowest level provides benefit, but progressively less as exceed min • Public good aggregation given by geometric mean (Cornes 1993): • If 2 regions, • What this means is regions have incentive to know what other will provide, since better off if don’t provide more. May or may not know.
Prevention based on cost Costs can represent technological, institutional, political, environmental, etc. differences, e.g., heterogeneous environments (diversity, islands vs. continents, etc.) Easier to invade, “high cost” Harder to invade, “low cost”
Objectives • Use “weaker link” public good model to describe prevention of invasive species • Compare equilibrium prevention levels to efficient levels • Investigate how the structure of information between regions (regarding cost of prevention) changes this
Model 2 region, static, utility maximization cH with probability θ 2 cost types: cL with probability (1-θ) • Solve & compare: • PO levels of prevention (Social planner) • Complete information equilibrium (NEq) • Incomplete information equilibrium (BNE)
Results: Underprovision of prevention PO prevention > NEq (complete info) prevention PO prevention > BNE (incomplete info) prevention → In equilibrium, prevention of invasive species will be underprovided compared to the efficient level How does NEq compare to BNE?
Deviation function • Need to look at expected difference between complete and incomplete information:
Ex ante analysis • Value of this function is positive given any θ, cH, cL → More prevention expected to be provided under complete information • Costs comparative statics:
Ex post analysis • Numerical analysis • After types are realized, how do provision levels compare? • Result: anything can happen • Under some specifications of θ, incomplete information more efficient
Lessons • Prevention of invasive species will be underprovided in equilibrium compared to the efficient level • Ex ante, incompleteness of information leads to inefficiently low levels of prevention • Ex post, possible that incomplete information more efficient
Implications and extensions • Complete information more efficient – make costs transparent (improved reporting, communication). We see this happening (GISP, NISC, NBII, ISSG…) • Costs closer together – higher efficiency – Pareto-improving transfers from low cost to high cost countries? • As a first step, focused on how weaker link technology affects equilibrium prevention • More complete model would include type of prevention activity, income/preferences, probability of invasion.
Thanks to USDA/ERS (43-3AEM-3-80083)& University of Hawaii Arts and Sciences Advisory Councilfor financial support