Summary Sheet Figures and Maps
80 likes | 97 Views
Explore HIV prevalence, viral load, ART use, and circumcision rates among adults based on SHIMS2 2016-2017 data. Findings presented with confidence intervals and achievement of 90-90-90 goals. Disclaimer: CDC logo use does not constitute endorsement. Funded by PEPFAR with CDC cooperation.

Summary Sheet Figures and Maps
E N D
Presentation Transcript
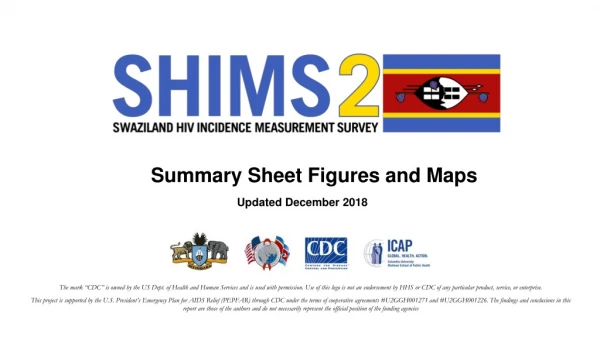
Summary Sheet Figures and Maps Updated December 2018 The mark “CDC” is owned by the US Dept. of Health and Human Services and is used with permission. Use of this logo is not an endorsement by HHS or CDC of any particular product, service, or enterprise. This project is supported by the U.S. President’s Emergency Plan for AIDS Relief (PEPFAR) through CDC under the terms of cooperative agreements #U2GGH001271 and #U2GGH001226. The findings and conclusions in this report are those of the authors and do not necessarily represent the official position of the funding agencies
HIV Prevalence by Age and Sex, SHIMS2 2016-2017 Error bars represent 95% confidence intervals.
Prevalence of Viral Load <1,000 copies/mL among all Participants living with HIV, Regardless of Knowledge of HIV Status or Reported ART Use, by Age and Sex, SHIMS2 2016-2017 Error bars represent 95% confidence intervals. Estimates in parenthesis are based on a small number (25-49) of unweighted cases and should be interpreted with caution.
Prevalence of Viral Load <1,000 copies/mL among Adults living with HIV, Regardless of Knowledge of HIV Status or Reported ART Use, by Region, SHIMS2 2016-2017
Achievement of the 90-90-90 Goals among HIV-Positive Adults, by Sex, SHIMS2 2016-2017 Error bars represent 95% confidence intervals. Inset numbers are conditional proportions.
Medical Circumcision among Adult Males, by Age, SHIMS2 2016-2017 Error bars represents 95% confidence intervals
Find the SHIMS2 Summary Sheet and additional PHIA Project Results at: https://phia.icap.columbia.edu The mark “CDC” is owned by the US Dept. of Health and Human Services and is used with permission. Use of this logo is not an endorsement by HHS or CDC of any particular product, service, or enterprise. This project is supported by the U.S. President’s Emergency Plan for AIDS Relief (PEPFAR) through CDC under the terms of cooperative agreements #U2GGH001271 and #U2GGH001226. The findings and conclusions in this report are those of the authors and do not necessarily represent the official position of the funding agencies