Download
1 / 32
320 likes | 350 Views
Learn about HIV prevalence calculation methods, epidemic states classification, and prevalence estimation in different populations to assess the impact of HIV/AIDS. Explore data needs, trends, and vulnerable groups.

E N D
Making HIV Prevalence and AIDS Estimates UNAIDS/WHO Working Group on Global HIV/AIDS and STI Surveillance
HIV/AIDS: Data Needs • What are the levels and trends in HIV infection? • Who is getting infected? • Who is more at risk for or vulnerable to HIV infection? • Impact assessment (need for care, planning) • Is the response effective?
UNAIDS/WHO Classification of epidemic states • LOW LEVEL: • HIV prevalence has not consistently exceeded five percent in any defined sub-population • CONCENTRATED • HIV prevalence consistently over five percent in at least one defined sub-population but below one percent in pregnant women in urban areas. • GENERALISED • HIV prevalence consistently over one percent in pregnant women nation-wide
Three Steps in Making Estimates • Calculating HIV Prevalence • Curve Fitting • Generating other variables (e.g., mortality, incidence)
Calculating HIV prevalence:Industrialized Countries • AIDS Back-calculation • Statistical method that allows estimating the past HIV incidence required to provide the present level of AIDS cases, corrected by underreporting • Curve fitting of past incidence • HIV Incidence estimates • HIV case reporting • Incidence studies using “detuned” ELISA
Calculating HIV prevalence:Developing Countries • Two different sets of procedures for: • low-level and concentrated epidemics • HIV is concentrated mainly in sub-populations which may vary from country to country (e.g., IV drug users, CSW, MSM) • generalized epidemics • HIV has spread widely in the adult population • primary mode of transmission is heterosexual
Calculating HIV prevalence: Concentrated Epidemics • Estimates are made by adding together: • the number of individuals assumed to be infected in each identifiable sub-population at risk. • a minimum estimate of HIV infection in the general population
Calculating HIV prevalence:concentrated and low-level epidemics • Identify risk groups • Estimate size of groups • Estimate HIV prevalence in risk groups • Estimate HIV prevalence in the general population • Sum of all groups
Estimating Prevalence in a Concentrated Epidemic Assumptions: MSM population: Used 2% of adult men for low and 4% for high MSM Prevalence Rate Used 1995 prevalence data (15%), with 10% for low and 20% for high STI Population Used 1% of adult as low, 2% as high. Assume higher rates among men STI Prevalence Rate 96-97 sentinel surveillance = 4.3%, used 3.3 as low and 5.3 as high General Population: Used 2000 UN population numbers for 15-49 minus the risk groups General population prevalence Based on anc sentinel data (0.55%). Used adjustment for rural, then had 0.1% for low, and 0.3% for high
Estimating Prevalence in a Concentrated Epidemic Population Size Population Size Percent Infected Percent Infected Low-Low Low-High High-Low High-High Population High Low High Low Estimate Estimate Estimate Estimate IVDU 700,000 244,400 0.6 0.078 19,063 146,640 54,600 420,000 CSW Promiscuous People 502,260 125,565 0.01 0.003 377 377 377 5,023 People with STI 565,043 376,695 0.0084 0.0028 1,055 1,055 1,055 4,746 General (15-49) 23,345,698 24,366,340 0.0012 0.0007 17,056 17,056 17,056 28,015 Total 25,113,000 25,113,000 37,551 165,128 73,088 457,784 Assumptions: IVDU Population Size Used high estimate from Karl's paper (and close to 6% of males) and 2% of males as low (see table below) IVDU Prevalence Rate Used High from Lev's study in Odessa, and a low from Karl's registered IVDU's CSW * P.P. Population Used 2% of population for CSW/Promiscuous and .5% for low estimate CSW Prevalence Rate Used CSW prevalence rate from Karl's paper as high, half of that (overlap with IVDU) as low STI Population Used 15 times reported syphilis rate as high, and 10 times reported rate as low STI Prevalence Rate Used 50% higher than reported (Karl's paper) as high prevalence, 50% lower, as low General Population: Used 98 UN population numbers for 15-49 minus the risk groups General population prevalence Used anc rates for high and blood donors for low estimate
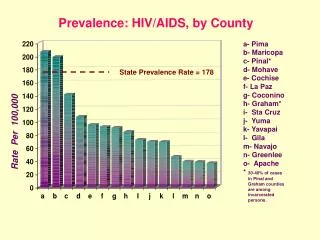
Calculating HIV prevalence: Generalized Epidemics • Prevalence estimates are based primarily on surveillance data collected from women attending antenatal clinics. • Two groups of clinics based on their location • major urban areas • outside major urban areas • median prevalence rates are calculated separately for the two groups
Calculating Prevalence 1. Determine median of urban and outside major urban sites 2. Adjust medians based on representativeness of sites 3. Apply adjusted rates to female urban and outside urban populations (15-49) 4. Use M/F ratio to determine number of men infected 5. Combine males and females to get adult rate
Critical Issues in Estimating Prevalence • Representativeness of ANC sites • Effects of HIV infection on fertility • Male-to-female ratio • Urban to rural prevalence differential
Representativeness of ANC:Other Factors • Age-related fertility reduction in HIV positive women • Changes in risk behaviors (condom use, contraception) • “Active aging” (risk beyond reproductive ages) • Selection and participation bias (users fees, availability/access to ANC services) These factors have been identified for further study but are not considered in the present methodology
Representativeness of ANC for total Population: Male/Female Differentials Population-based HIV prevalence in men and women - Lusaka, Zambia, 1995
Assessing Urban/Rural Differentials: Surveillance Data for Kenya
Comparison of HIV Prevalence Among Pregnant Women and All Adults 15-49 35 30 25 20 ANC Pop 15 10 5 0 Lusaka Mposhi Mwanza Rakai-90 Rakai-91 Rakai-92 Kisumu
Three Steps in Making Estimates • Calculating HIV Prevalence • Curve Fitting • Generating other variables (e.g., mortality, incidence)
Curve Fitting • Epimodel was used to fit a curve to yearly estimates of adult prevalence. • Not designed to make HIV projections. • Not designed to fit prevalence curves • Limited to the gamma curve • May not suitable for slowly progressing epidemics (Asia) • New curve-fitting software is being developed
EPIModel • Developed by WHO/GPA • Tool for making short-term projections of AIDS cases, AIDS mortality, paediatric AIDS and AIDS orphans. • NOT DESIGNED to make estimates or projections of prevalence of HIV infections
Curve Fitting • Point prevalence estimates (at least one, the more the better!) • Year of initial spread • Assumptions about peak of the epidemic • Post-peak curve assumptions
HIV Prevalence for Pregnant Women Major Urban and Outside Major Urban Areas Zambia 50.0 40.0 30.0 20.0 10.0 0.0 1985 1987.5 1990 1992.5 1995 1997.5 2000 Year URBAN OUTSIDE MED-URBAN MED-OUTSIDE UNAIDS/WHO adult prevalence curve
Three Steps in Making Estimates • Calculating HIV Prevalence • Curve Fitting • Generating other variables (e.g., mortality, incidence, orphans)
Generating Other Variables • Epimodel (or the new model) is used to generate additional information on • Incidence • Vertical transmission • Mortality (adult and child) • Orphans
Generating Other Variables:information needed • Population size (15-49) • Progression rates from infection to death • Age specific fertility rates • Fertility reduction for HIV • Male-to-female ratio • Mother-to-child transmission rate
Age-specific information about population and fertility • United Nations Population Division estimates: • age-specific fertility rates • population figures
Generating Other Variables Progression Rates • Infection to death for adults • Median 9 years in countries with poor health care • Median 11 years in countries with better health care • Infection to death for children • Median 2 years in countries with poor health care • Median 4 years in countries with better health care
Progression Rates Child Survival Rates Adult Survival Rates 100 100 90 90 80 80 70 70 60 60 Percent surviving Fast Percent surviving 50 50 Slow Slow Fast 40 40 30 30 20 20 10 10 0 0 1 2 3 4 5 6 7 8 9 10 11 12 13 14 15 16 17 18 19 20 1 2 3 4 5 6 7 8 9 10 11 12 13 14 15 16 17 18 19 20 Years since infection Years since infection
Estimating Vertical Transmission • Male to female ratio • Fertility rate • Fertility reduction for HIV+ • Vertical transmission rate • (25% 10%) • Impact of ARV prophylaxis on MTCT
Mortality estimates • Due to the limitations in vital registration and case reporting, AIDS deaths are derived from the estimated HIV prevalence curve and the progression rate from infection to AIDS and death • Pre-AIDS mortality(deaths in HIV infected adults and children due to other causes unrelated to HIV) is deducted from the total mortality estimate
Projections • He who predicts the future lies, even if he is telling the truth! • Predictions are very difficult, particularly when the future is concerned.