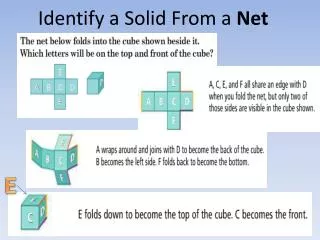
Download

1 / 65
650 likes | 675 Views
Interpret the distances traveled, temperatures, and heights from the given graphs to understand different scenarios in various contexts. Identify key points in the graphs to draw meaningful conclusions.

E N D
Identify Key Information from a Graph N-Q.1, F-IF.4, F-LE.1
Jenny sets out at 7:00 am to go for a jog. The following graph shows her distance D(t) from home, in miles, as a function of time, t, in minutes, starting at 7:00 am.
Where was Jenny at 7:00 am? At 7 AM, Jenny was at home.
Approximately when was Jenny farthest from home? Jenny was farthest from home at 7:40
What is the farthest Jenny traveled from home? The furthest Jenny traveled from home was 3.5 miles
How far from home was Jenny at 8 AM? Jenny was 2.5 miles from home
For what value(s) of t does D(t) = 3? Explain the meaning of your answers in context. t = 30 and 50. This means that Jenny is 3 miles away from home at 7:30 and 7:50
At what time did Jenny return home? Jenny returned home at 8:30 AM
Describe what Jenny might be doing between 7:10 and 7:20 am. Answers will vary
The following graph shows the temperature T(t) in degrees Celsius, at a certain crater on the planet Mercury, t minutes after sunrise
What was the temperature at sunrise? The temperature was -60 degrees
What is the value of T(8) and what does it represent in context? T(8) = 60. This means 8 minutes after sunrise it is 60 degrees
When was the temperature 30 degrees below 0? At about 2.5 minutes after sunrise, the temp was 30 degrees below 0
When did the temperature reach 0 degrees Celsius? Explain how you know. The temp reached 0 degrees after 4 minutes. This is known because it crosses the 0 line and becomes positive after this point.
How long did it take after sunrise for the temperature to reach 30 degrees above 0? It took 2.5 minutes to reach 30 degrees above 0
Kaleo leans over and throws a ball straight upward from a rooftop. The following graph shows the height, h(t), of the ball, in feet, over time t, in seconds, beginning at the moment he released the ball
What is the value of h(0)? What does your answer mean in context? The value of h(0) is 50. This means the ball is dropped from 50 feet.
When did the ball reach its maximum height? The ball reached its maximum height after 1 second
What was the maximum height of the ball? The maximum height of the ball was 90 feet
For what value(s) of t does h(t) = 0? Explain the meaning of your answer(s) in context. t = 2.5. This means that after 2.5 seconds the ball is on the ground.
Did the ball land back on the roof? Explain how you know. The ball did not land back on the roof because it landed on the ground. You can tell by the height.
Approximately when was the ball 80 feet above the ground? The ball is approximately 80 feet above the ground at 0.5 and 1.5 minutes
The graph above shows the fuel economy of Jackson’s car, in miles per gallon, as a function of the speed, in miles per hour, at which he drives
How many miles/gallon can Jackson expect if he drives 40 mph? He can expect 35 mpg if he drives 40 mph
If Jackson hopes to get at least 30 miles/gallon, what is the fastest he can drive? To get at least 30 mpg, the fastest Jackson can drive is 55 mph
Approximately how many miles/gallon can Jackson expect when driving 50 mph? Jackson can expect about 32 mpg if he drives 50 mph
What is the approximate maximum fuel economy of Jackson’s car? The best fuel economy Jackson can get is about 38 mpg
If Jackson hopes to never achieve less than 25 miles/gallon, what is the fastest he can drive? Jackson can drive 65 mph if he doesn’t want to go under 25 mpg.
Describe the relationship between fuel economy and speed. The faster you drive, the less your fuel economy is.
The graph below shows Jessica’s projected SAT math score as a function of the number of practice tests she takes
What score can Jessica expect on her math SAT if she doesn’t take any practice tests? She can expect a 400 if she doesn’t practice.
What score can Jessica expect if she takes 7 practice tests? If Jessica takes 7 practice tests, she can expect a 600
How much can Jessica improve her score by taking 2 practice tests? She can improve her score by 100 points
What is the minimum number of practice tests Jessica must take if she hopes to earn a score of at least 500? She will need to take 3 practice tests to score at least 550
How many practice tests should Jessica take to maximize her score? Jessica should take 5 tests to maximize her score.
What is Jessica’s maximum projected score? Jessica’s maximum projected score is about 650.
Kai has a cell phone plan that includes a fixed amount of data usage. He will pay extra data usage that exceeds this fixed amount. The following graph shows the monthly cost of Kai’s cell phone as a function of the number megabytes of data he uses.
What is the minimum amount Kai will pay each month for his cell phone? The minimum amount Kai will pay is 60 dollars
How much will Kai pay if he uses 200 MB of data? Kai will pay $60 if he uses 200 MB of data
If Kai’s bill is $80, how much data did he use? If Kai’s bill is $80, then he used 500 MB of data.
How much will Kai pay if he uses 600 MB of data? Kai will pay $90 if he uses 600 MB of data.
If Kai’s bill is $140, how much data did he use? If Kai’s bill was $140, he used 850 MB of data
How many megabytes of data appear to be included in Kai’s plan at no additional cost? 300 MB of data are included in Kai’s plan at no additional cost.
Malia plans to order some t-shirts for a fundraiser. The following graph shows the cost per shirt as a function of the number of shirts ordered.