Download
1 / 39
400 likes | 424 Views
Explore the growth prospects for Argentina, Brazil, and Chile in this insightful analysis by Mr. Roberto Villambrosa. Understand the impacts of OPEC's oil production increase and the Federal Reserve's interest rate decisions on these economies.

E N D
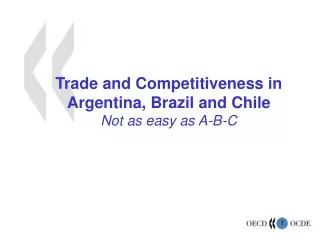
TRADE AND COMPETITIVINESS IN ARGENTINA, BRAZIL AND CHILE. Mr. Roberto Villambrosa 22 November, 2004
GROWTH PERSPECTIVES FOR LATIN AMERICA • On the second quarter of 2004, the announcement of OPEC to increase the production of crude oil and the decision of the Federal Reserve to raise the reference interest rate to 1.25%, led to financial volatility that afected capital markets. • It is expected an expansion of 4.5% annual of the GDP (the highest since 1997), for Latin America. • Risks of the international context: - In the short run: oil price volatility. - In the medium term: the imbalances of the american foreign trade and the expected lower rates of growth in the chinesse economy. - In the long run: some weakness for a sustained growth (external debt, high unemployement and investment rates in the region).
GROWTH PERSPECTIVES FOR LATIN AMERICA Latin American countries exports (million U$S) Source: UNSD comtrade data base During the first five months of 2004, exports from Argentina, Brazil, Chile, Ecuador, Mexico, Peru and Uruguay (wich represent more than 90% of the commerce of the region), increased 20% annual with respect to 2003, due to the strong growth of the interegional trade (50% annual). The main markets are: United States, European Union, with 50% and 13% of the total exports, and trade surplus with China.
ACTIVITY Recovery started in the second quarter of 2002, and there have been eight consecutive quarters of growth for the first time since 1997. Gross domestic product at 1993 prices (million of pesos) Seasonally adjusted gross domestic product at 1993 prices (million of pesos)
ACTIVITY Activity level and current account Source: Secretaria de Politica Economica, Ministerio de Economia.
ACTIVITY Labour intensive sectors such as textiles, metalmechanics and construction, recovered strongly in 2002. MIE –TEXTILES Seasonlly adjusted MIE –HEAVY ENGINEERING INDUSTRY Seasonlly adjusted
ACTIVITY Fixed gross investment: level and composition (at 1993 prices –in million of pesos) Durable equipment / Fixed gross investment (%)
RECOVERY OF THE ECONOMIC ACTIVITY Economic activity and imports Source: Indec, BCRA, Ipeadata, Federl Reserve of St. Luois.
ACTIVITY Imports of capital goods influenced by investment recovery. Import of goods: level and composition (in million of dollars CIF) Imports of capital goods in percent of total imports
PRICES Since April 2002, fiscal and monetary policies led to lower rates of inflation. Wholesale prices Average MoM Change variation Consumer prices Average MoM Change variation
FOREIGN TRADE Depreciation of the peso led to a significant surplus in Argentina´s foreign trade, as a result of import substitution.
EXTERNAL TRADE Source: IDEC On september 2004, exports have experinced an increase of 25.3% with respect to the same month on 2003, while imports increased a 57.2% during the same period. The balance acumulated during the firts nine months of 2004 raises to 9.541 millions of dollars.
CURRENT ACCOUNT Exports and imports of goods, balance of goods and current account balance (million of US$) Source: Secretaria de Politica Economica, Ministerio de Economia.
IMPORTS AND EXCHANGE RATE Evolution of imports and nominal exchange rate (million U$S) Source: Ministerio de economia y produccion.
EXTERNAL TRADE Exports by type of good (millons of US$) Source: INDEC Annual variations January-September 2004 (%) Source: INDEC
EXTERNAL TRADE Imports by type of goods (millons of US$) Annual variation January-September 2004 (%) Source: INDEC Source: INDEC
EXTERNAL TRADE Exports by Economic Area Jan-Sep 2004 Imports by Economic Area Jan-Sep 2004 Source: INDEC
EXTERNAL TRADE Source: INDEC
MERCOSUR Argentine exports to Mercosur (million U$S) Source: Centro de Economia Internacinal
MERCOSUR Evolution of argentine exports -within the bloc and outside the bloc- (million U$S) Source: Centro de Economia Internacinal Between 1991 (initiation tariff reduction) and 2003 and, inspite of the reduction of trade caused by the succesive macroeconomic crises in the region in recent years, Argentine exports increased more speedily within the bloc (14.5% and 11% y-o-y average, respectively)
MERCOSUR Mercosur helped to reverse the structurally negative balance with Brazil. In the fifteen years before the Customs Union was stablished, Argentina had a bilateral negative balance of U$S 4.3 billion. In the subsequent nine years, this imbalance became a surpluse of U$S 8.5 billion.
TRADE WITH BRAZIL Brazilian participation in Argentina´s exports and imports Source: INDEC After the crisis of 2002, Argentina slowly recovered participation in brazilian exports. During the second quarter of 2004, Argentina recived 7.5% of brazilian total exports. (2001). Argentina has diminished its participation in the brazilian market during the last three years.
TRADE WITH BRAZIL BALANCE OF TRADE WITH BRAZIL 2003-2004 Source: INDEC
TRADE WITH BRAZIL External price index january 2001 =100 Variation Jan- aug 03/jan-Aug 04 Source: INDEC
TRADE WITH BRAZIL Participation of Argentina and U.S. in bazilian imports Source: INDEC and aliceweb Despite the fall of Argentina`s participation in the brazilian market, Argentina represents the second supplier to Brazil (the 9.7% of brazilian imports are from Argentina), after U.S., wich represent the 20% of the total imports. Both, Argentina and U.S. show a decreasing trend.
TRADE WITH BRAZIL Bilateral real exchange rate with Brazil (2001=100) Source: Indec, BCRA, Ipeadata, Federl Reserve of St. Luois. During the first months of 2002 the bilateral exchange rate strongly decreased, after the devaluation of the peso and the revaluation of the real. The real exchange rate recoverd on february 2003. On july 2003, the peso kept a stable path, while the real expericed an apreciation of 3%. The real exchange rate increased due to an increase of the price index in Brazil.
TRADE WITH CHILE Trade balance Argentina-Chile (million U$S) Source: INDEC
TRADE WITH CHILE Chilean participation in Argentine exports and imports Source: INDEC
TRADE WITH CHILE Argentine, Brazilian and U.S. Participationin Chilean imports During the last years Argentina gained participation in Chilean market.
TRADE WITH UNITED STATES Real exchange rate –multilateral and bilateral with the U.S. (2001=100) Source: FMI, Worl bank, Federal Reserve of Saint Louis, Fundacion Julio Varga.
RECOVERY OF THE ECONOMIC ACTIVITY Imports by origin –Participation 2003/2004- Source: INDEC
RECOVERY OF THE ECONOMIC ACTIVITY Trade balance –seven months 2003/2004 (million US$) Source: INDEC During january-july 2004, our country registered positive trade balances with most of its trade parteners. The only exeption was Brazil. The balance o trade with MERCOSUR was - 901million dollars.
RECOVERY OF THE ECONOMIC ACTIVITY Multilateral real exchange rate and bilateral real exchange rate with Brazil and U.S. 2001=100 The stability of the nominal exchange rate and domestic prices, after the apreciation of the dollar, determined that the real exchange rate stabilizes in levels higher than the ones registered before the devaluation Competitivty with the U.S. is falling since the first moths of 2003, due to the apreciation of the euro. Source: FMI, Worl bank, Federal Reserve of Saint Louis, Fundacion Julio Varga.
LABOUR COST • Unit labor cost: This index represent the total labour cost needed to produce one unit of output. w : Medium nominal wage (including taxes) L: Number of workers or number of hours worked Q:Total output e: Nominal exchange rate • A fall in the wage- exchange rate relation (w/e) has a positive impact in the ULC, therefore the cost decreases. • When productivity (Q/L) rises the ULC falls, since the incidence of wages will be lower, therefore competitiviness increases.
LABOUR COST • Relative Competitiviness Index: In oder to compare the evolution of the ULC between two coutries, we use the Relative Competitiviness Index (RCI) • Index relates the ULC of country i respect the ULC of country j. • Rises in the RCI imply that country i is less competitive than country j.
UNIT LABOUR COST Unit labour cost index (1993=100) Source: LA COMPETITIVIDAD DEL MERCOSUR FRENTE AL ALCA, Jorge Lucangeli • The rise in th UCL between 1990-1995 is explained by 50% increase in nominal wages. • Since 1995 prouctivity rose and wages stabilized, therefore the ULC fell, increasing competitiviness respect the rest of the countries analized.
Relative Competitiviness Relative competitiviness index (1993=100) Source: LA COMPETITIVIDAD DEL MERCOSUR FRENTE AL ALCA, Jorge Lucangeli
PRODUCTIVITY AND WAGES Evolution of productivity and wages (1990=100) Source: LA COMPETITIVIDAD DEL MERCOSUR FRENTE AL ALCA, Jorge Lucangeli
PRODUCTIVITY AND WAGES Evolution of productivity, wages and ULC (1990=100) Source: LA COMPETITIVIDAD DEL MERCOSUR FRENTE AL ALCA, Jorge Lucangeli