Download
1 / 29
290 likes | 442 Views
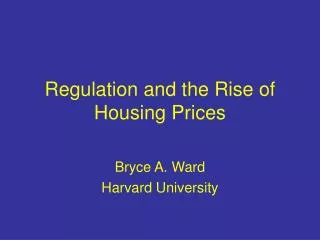
Regulation and the Rise of Housing Prices in Greater Boston. Presentation by Edward Glaeser & Amy Dain January 5, 2006. Top Five Metropolitan Areas By Housing Price Appreciation. OFHEO Repeat Sales Price Indices 1980-2004, CPI Adjusted Nassau-Suffolk (NY) 251%

E N D
Regulation and the Rise of Housing Prices in Greater Boston Presentation by Edward Glaeser & Amy Dain January 5, 2006
Top Five Metropolitan Areas By Housing Price Appreciation OFHEO Repeat Sales Price Indices 1980-2004, CPI Adjusted • Nassau-Suffolk (NY) 251% • Boston Quincy (MA) 210% • Cambridge-Newton (MA) 180% • Essex County (MA) 179% • Salinas (CA) 162%
Rising Housing Prices Mean Rising Demand, But High Demand Doesn’t Have to Mean High Prices In Houston, Las Vegas and Phoenix NAR median sales prices were under $200,000 last year. Boston’s NAR median sales price was $418,000. But there were 45,000 in permits in Houston last year and 32,000 in Vegas as opposed to 8,200 in Boston.
Examples of Low Density and Low Production • Lincoln, Weston, and Concord together include more than 61 square miles or 39,000 acres, and contain only 12,889 homes. • Yet in these three places, which currently have on average more than three acres per home, there were a total of 1,746 single-family units permitted between 1980 and 2002. • There are another 25 localities within our sample with less than one home for every two acres that allowed less than 600 new units between 1980 and 2002.
What Does an Acre Cost? • If land is just scarce, then land should be as expensive if it extends an existing lot or if it sits under a new lot. • But on average, an extra acre costs only $16,600 in our sample. • If an acre sits under a new home, it’s worth $450,000. • This difference is impossible without regulation.
Municipalities • Studied • Within 50 miles of Boston • 187 municipalities • Over half of state’s 351 cities and towns
Regulations Studied Database: Answers to over 100 questions about regulations in each municipality. Sample: 187 municipalities 187 zoning bylaws/ordinances 181 subdivision regulations (road design standards) 131 wetlands bylaws/ordinances(over 2/3 of 187) 109 septic regulations(over 2/3 of 161 municipalities not 100% on sewer*) *26 municipalities 100% on sewer.
Lot Size – Single Family Lots • MassGIS data (from ’99, ’00) • 2-acre lots zoned in over 90% of town’s area: • Boxford • Carlisle • Lincoln • Medway • Berlin • Bolton • Dunstable • 8. Groton • 9. Paxton • 10. Plympton • 11. Princeton • 12. Rehoboth • 13. Sutton • 14. Townsend Half of the municipalities (95 of 187) zone over 50% of land area for one acre lot sizes or larger. Frontage, setbacks, width, yard size…
Lot Shape “No pork chop, rattail, or excessively funnel-shaped or otherwise gerrymandered lots shall be allowed.” – Millbury Zoning Bylaw Perimeter/area ratios: (p2/a)/(a/r)<=X, with X ranging from 20 to 30 -6 municipalities p2/a<=X, with X ranging from 22 to 45 -26 municipalities p/a<=X, with X ranging from 0.02 to 0.08 -7 municipalities Other shape requirements: Fit circle, square, rectangle, ellipsis within lot lines. Key p = perimeter a = actual lot area r = required lot area
Cluster/Flexible Zoning (Open Space Preservation Design, Conservation Subdivision, PUD) • 80% of municipalities have it. • Only scattered success. • Of ¾ of municipalities that told us • results of cluster zoning… • 18 said: built a lot of cluster • 16 said: no cluster built • Most said: ‘not much, a few’ • Minimum parcel size too big • Process risky and time consuming • Tyngsborough’s 2004 Master Plan recommends: “Eliminate requirement that Town Meeting approve each Open Space Residential Development.” • Not enough flexibility • No additional units above conventional zoning plan • “No density bonus in ours. Why would you cluster?” – Town Planner
Multi-family Zoning • No MF allowed • Bolton • Boylston • Bridgewater • Dighton • Lakeville • Littleton • Mendon • Nahant • Seekonk • West Bridgewater • MF only if 55+ • Boxford • Carlisle • Lynnfield • Marshfield • Paxton • Plympton • Wenham • Hanover (townhouse only) • Medway (townhouse only) “It may technically say that you can build multi-family, but the bar is so high that you can’t build under it.” -Planner in town south of Boston • Barriers to MF development where “allowed”: • Minimum parcel size • Dimensional requirements • Re-zoning often required; special permits also risky • MF district built-out Example: Westborough has Garden Apartment and High Rise Apartment Districts. Westborough’s Master Plan states: “Although these districts appear to provide ample alternatives to single-family housing in the Town, in reality they do not since virtually no land is zoned for multi-family housing.”
Accessory Apartments In Owner-Occupied Single-Family Homes Almost 60% of municipalities explicitly allow them Most restricted to relatives of the owner (“in-law apartments”) Just over 1/4 of municipalities allow accessory apartments with no occupancy restrictions Due to the occupancy restrictions, many must be re-permitted or re-certified on a regular basis -When relatives move out, the kitchen must be removed and apartment reintegrated
8 feet 6 feet Subdivision Regulations Road Width for New Neighborhoods Most common: 24 -28 feet of pavement. 37 require 30+ feet. (20% of sample) 20 require no more than 22 feet. “You don’t want to end up with a sea of pavement.” -Planner in community south of Boston with 32-foot pavement requirement
Wetlands Regs: Land Subject to Flooding 2/3 of municipalities have passed wetlands bylaws/ordinances. Wetlands Protection Act protects “isolated land subject to flooding” – standing water, volume ¼ acre-foot, once per year. 59 municipalities expand definition of flooding 11: 1/8 acre-foot 5: 2,000 sq.ft. (1/20th of acre) Dover: 1/6 acre-foot Hingham: 1/16 acre-foot Gloucester: 1/43 acre-foot Wrentham: 3/43 acre-foot Taunton: 1,000 sq.ft. surface area and 100 cubic feet volume Wayland: 500 sq.ft. surface area Swansea: 1,000 sq.ft. surface area that floods once every five years. 24: variations on “temporary inundation… that covers land not usually under water” Many lack definitions of flooding altogether, even when they indicate some increased protection for LSF.
Septic Regulations • 109 municipalities have local septic regulations, • supplements to Title 5 • Percolation rate • 29 have stricter perc rate requirement than Title 5’s “60 minutes/inch” • Maximum perc rate – 20 minutes per inch • Canton • Topsfield • Tewksbury • Westford • Sherborn • Ipswich 7. Berkley 8. Harvard 9. Mansfield 10. Marshfield 11. Lakeville 12. Bridgewater
Lot Size and Housing Stock • In 1970, each acre per lot is associated with 41 percent less housing. • In 2000, each acre per lot is associated with 36 percent less housing. • Controls for town area, housing stock in 1940, and a number of 1940 controls (to avoid endogeneity). • Can be interpreted as houses per acre or housing growth 1940 – 1970 or 1940-2000.
Lot Size and Permits • Each acre per lot is associated with 33 percent fewer permits 1980-2002 • 33 percent less permits in the 1980s and 41 percent less permits in the 1990s • Controls for 1970 era characteristics including housing stock, university presence, percent college graduate • Coefficients rise with 1940 controls (.5)
Individual Impacts of Environmental and Subdivision Regulations Permitting drops: • About 10 percent when localities impose stricter than state standards for wetlands • About 4 percent when localities impose stricter than state standards for septic systems • About 12 percent when they adopt new subdivision regulations • But none of these results are statistically significant
Combined Impacts of Environmental and Subdivision Regulations • Combine wetlands, septic, and subdivision regulations into one index • Each additional form of regulation is associated with a 10 percent reduction in permitting • The coefficient is statistically significant
Cluster Zoning and Permits • Cluster zoning appears to increase permits by 20 percent with town controls. • The cluster effect is 8.6 percent with town fixed effects. • Inclusionary zoning has a positive effect with town controls, but a negative effect with town fixed effects. • Some of these rules are actually taxes on new development.
Zoning’s Impacton Prices • Zoning should increase prices everywhere not just the affected town because supply is restricted in the whole region. • Two towns that are otherwise identical need to have identical prices. • If Saudi Arabia reduces its oil production, it doesn’t raise the price of Saudi Crude relative to Venezuelan Crude.
Nonetheless, We Look at Prices • Basic effect on median sales price with 1940 controls is each acre per lot raises prices by 15.8 percent in 1987, 11.3 percent in 1995 and 19.5 percent in 2001. • Each acre per lot reduces the share of affordable housing by 20 percent. • With house characteristics, effect drops to 13 percent, and disappears once you control for 1970 density level.
High Housing Prices Mean Firms Must Pay High Wages To Attract Workers
Policy Proposals Must Address Four Features • Localities have strong incentives to restrict new development • Localities have the ability and incentives to subvert state-level policies • The current system has too much uncertainty • Property rights are diffuse and ill defined
Four Policy Approaches • Use big carrots and sticks • Override local controls • Reform the legal environment • Replace some controls with fees
Summary • Housing prices and land use regulations are linked • Minimum lot sizes have a dramatic impact • Local rules for wetlands, septic systems, and subdivisions also play an important role • Effective responses require significant state-level actions