Download
1 / 44
450 likes | 562 Views
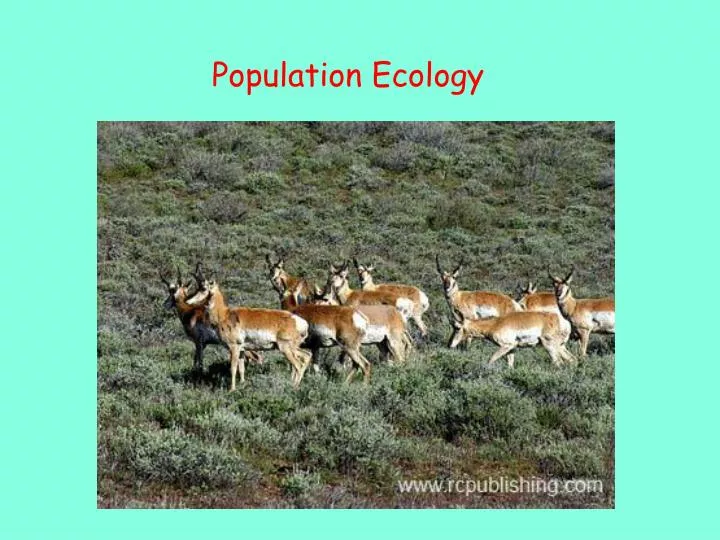
Population Ecology. Study of populations in relation to environment. Environmental influences on: population density population distribution (dispersion) age structure. Definition of Population:.

E N D
Study of populations in relation to environment • Environmental influences on: • population density • population distribution (dispersion) • age structure
Definition of Population: • Group of individuals of a single species living in a specific geographic region at the same time
Density: A Dynamic Perspective • Determining the density of natural populations is possible, but difficult to accomplish • In most cases it is impractical or impossible to count all individuals in a population • How do wildlife biologists approximate populations?
Estimating Wildlife Population Size Defined Populations -complete counts -incomplete counts -indirect counts Undefined Populations Mark and Recapture
Births and immigration add individuals to a population. Births Immigration PopuIationsize Emigration Deaths Deaths and emigration remove individuals from a population. • Density is the result of a dynamic interaction of processes that add individuals to a population and those that remove individuals from it • How do these factors • Contribute to Population Size?? • Births • Deaths • Immigration • Emigration
Patterns of Dispersion • Environmental and social factors influence the spacing of individuals in a population
Clumped Dispersion • Individuals aggregate in patches • May be influenced by resource availability and behavior
Uniform Dispersion • Individuals are evenly distributed • May be influenced by social interactions such as territoriality
Random Dispersion • Position of each individual is independent of other individuals (c) Random. Dandelions grow from windblown seeds that land at random and later germinate.
Life history traits are products of natural selection • Life history traits are evolutionary outcomes • Reflected in the development, physiology, and behavior of an organism
Semelparity: Big Bang • Reproduce a single time and die • putting all available resources into maximizing reproduction at the expense of future life
Iteroparity – Repeated Reproduction • produce offspring repeatedly over time • increased parental care along with enhanced energetic investment per offspring
100 Male Female 80 60 Parents surviving the following winter (%) 40 20 The lower survival rates of kestrels with larger broods indicate that caring for more offspring negatively affects survival of the parents. CONCLUSION 0 Reduced brood size Normal brood size Enlarged brood size “Trade-offs” and Life Histories • Which may lead to trade-offs between survival and reproduction • Organisms have finite resources RESULTS • Kestrels: • Produce a few eggs? • Can invest more into each, ensuring greater survival • Produce many eggs? • Costly but if all survive, fitness is better
More is Better? • Some plants produce a large number of small seeds • Ensuring that at least some of them will grow and eventually reproduce
Fewer is Better? • Other types of plants produce a moderate number of large seeds • That provide a large store of energy that will help seedlings become established
Demography • Study of the vital statistics of a population • And how they change over time • Death rates and birth rates • Zero population growth • Occurs when the birth rate equals the death rate
Exponential Population Growth Population increase under idealized conditions No limits on growth • Under these conditions • The rate of reproduction is at its maximum, called the intrinsic rate of increase
Example-understanding growth Question: I offer you a job for 1 cent/day and your pay will double every day. You will be hired for 30 days. Will you take my job offer? Answer: If you said YES, you will have made $~21 million dollars for 30 days of work. How is this possible?????
Amount of Pay/Day # of Days 1ST DAY OF WORK: 1 cent pay/day 30TH DAY OF WORK: ~10.2 million/day How is this possible?????
dN rmaxN dt Exponential Growth Model *Idealized population in an unlimited environment *Very rapid doubling time; steep J curve *r=N=(b-d)N t r=instrinsic rate of growth
8,000 6,000 Elephant population 4,000 2,000 0 1900 1920 1940 1960 1980 Year Exponential Growth in the Real World • Characteristic of some populations that are rebounding • Cannot be sustained for long in any population
Logistic Population Growth • A more realistic population model • Limits growth by incorporating carrying capacity
Logistic Population Growth • Carrying capacity (K) • Is the maximum population size the environment can support • In the logistic population growth model • The per capita rate of increase declines as carrying capacity is reached
2,000 dN 1.0N Exponential growth dt 1,500 (K N) K 1,500 dN rmax N Logistic growth dt K Population size (N) 1,000 dN 1,500 N 1.0N dt 1,500 500 0 0 5 10 15 Number of generations Logistic Population Growth • Produces a sigmoid (S-shaped) curve Figure 52.12
1,000 800 600 Number of Paramecium/ml 400 200 0 0 5 15 10 Time (days) (a) A Paramecium population in the lab. The growth of Paramecium aurelia in small cultures (black dots) closely approximates logistic growth (red curve) if the experimenter maintains a constant environment. The Logistic Model and Real Populations • The growth of laboratory populations of Paramecium • Fits an S-shaped curve
180 150 120 90 Number of Daphnia/50 ml 60 30 0 160 0 40 60 100 120 140 20 80 Time (days) (b) A Daphnia population in the lab. The growth of a population of Daphnia in a small laboratory culture (black dots) does not correspond well to the logistic model (red curve). This population overshoots the carrying capacity of its artificial environment and then settles down to an approximately stable population size. Logistic Growth and The Real World • Some populations overshoot K • Before settling down to a relatively stable density What type of feedback loop is this?
80 60 40 Number offemales 20 0 1995 2000 1980 1985 1990 1975 Time (years) (c) A song sparrowpopulation in its natural habitat. The population of female song sparrows nesting on Mandarte Island, British Columbia, is periodically reduced by severe winter weather, and population growth is not well described by the logistic model. Logistic Growth and the Real World • Some populations • Fluctuate greatly around K
The Logistic Model and Life Histories • Life history traits favored by natural selection • May vary with population density and environmental conditions
Natural selection (diverse reproductive strategies) a) Relatively few, large offspring (K selected species) b) Many, small offspring (r selected species) (K selected species) (r selected species)
Populations Regulated Biotic and Abiotic Factors Two general questions we can ask about regulation of population growth • What environmental factors stop a population from growing? • 2. Why do some populations show radical fluctuations in size over time, while others remain stable?
4.0 10,000 3.8 3.6 Average number of seeds per reproducing individual (log scale) 1,000 3.4 Average clutch size 3.2 3.0 100 2.8 0 0 40 50 60 80 20 30 10 70 0 10 100 Seeds planted per m2 Density of females (a) Plantain. The number of seeds produced by plantain (Plantago major) decreases as density increases. (b) Song sparrow. Clutch size in the song sparrow on Mandarte Island, British Columbia, decreases as density increases and food is in short supply. Competition for Resources • In crowded populations, increasing population density • Intensifies intraspecific competition for resources
Many vertebrates and some invertebrates are territorial • Territoriality may limit density • Cheetahs are highly territorial • Using chemical communication to warn other cheetahs of their boundaries
Territoriality: Ocean birds • Exhibit territoriality in nesting behavior
Health • Population density • Can influence the health and survival of organisms • In dense populations • Pathogens can spread more rapidly
730,000 100,000 Commercial catch (kg) of male crabs (log scale) 10,000 1990 1950 1980 1960 1970 Year Figure 52.19 Fluctuations in Population Size • Extreme fluctuations in population size • Are typically more common in invertebrates than in large mammals
Metapopulations and Immigration • Metapopulations • Groups of populations linked by immigration and emigration
60 50 40 Mandarte island Number of breeding females 30 20 Small islands 10 0 1991 1988 1989 1990 Year Immigration- Movement Into a Population • High levels of immigration combined with higher survivalcan result in greater stability in populations Figure 52.20
Snowshoe hare 160 120 Lynx 9 Lynx population size (thousands) Hare population size (thousands) 80 6 40 3 0 0 1850 1875 1900 1925 Year Population Cycles • Many populations undergo regular boom-and-bust cycles • Influenced by complex interactions between biotic and abiotic factors
Human Populations 6 5 4 Human population (billions) 3 2 The Plague 1 0 8000 B.C. 4000 B.C. 3000 B.C. 2000 B.C. 1000 B.C. 1000 A.D. 2000 A.D. 0 Figure 52.22 • No population can grow indefinitely and humans are no exception
Global Carrying Capacity • Just how many humans can the biosphere support? • Carrying capacity of earth is unknown…. http://www.youtube.com/watch?v=9_9SutNmfFk http://www.youtube.com/watch?v=UUOEcNomakw&feature=rec-LGOUT-exp_fresh+div-1r-8-HM http://www.youtube.com/watch?v=4B2xOvKFFz4&feature=related
Age Structure • One important demographic factor in present and future growth trends • Is a country’s age structure, the relative number of individuals at each age
Rapid growth Afghanistan Decrease Italy Slow growth United States Male Female Female Male Male Age Age Female 85 85 80–84 80–84 75–79 75–79 70–74 70–74 65–69 65–69 60–64 60–64 55–59 55–59 50–54 50–54 45–49 45–49 40–44 40–44 35–39 35–39 30–34 30–34 25–29 25–29 20–24 20–24 15–19 15–19 10–14 10–14 5–9 5–9 0–4 0–4 8 8 8 6 6 6 4 4 4 2 2 2 0 0 0 2 2 2 4 4 4 6 6 6 8 8 8 Percent of population Percent of population Percent of population Figure 52.25 • Age structure is commonly represented in pyramids
60 80 50 60 40 Infant mortality (deaths per 1,000 births) Life expectancy (years) 40 30 20 20 10 0 0 Developed countries Developed countries Developing countries Developing countries Figure 52.26 Infant Mortality and Life Expectancy • Infant mortality and life expectancy at birth • Vary widely among developed and developing countries but do not capture the wide range of the human condition